
.svg)
.svg)
.svg)
.svg)


.svg)
And while Journey Foods will definitely be joining in the pride festivities throughout June, we wanted to take a quick detour and look back in appreciation for our AAPI community (Asian Americans and Pacific Islanders).
In case you missed it, last month was Asian Pacific American Heritage Month.
It’s a time where we reminisce and appreciate the past generations of Asians and Pacific Islanders who gave so much and enriched America through their heritage and culture.
As Journey Foods is a food company, we wanted to also shed some light on the impact the AAPI community has had in the world of food.
Who Does Asian Pacific American Heritage Month Celebrate?
Here’s what “Asia/Pacific” entails, according to the Library of Congress:
“A rather broad term, Asian/Pacific encompasses all of the Asian continent and the Pacific islands of Melanesia (New Guinea, New Caledonia, Vanuatu, Fiji and the Solomon Islands), Micronesia (Marianas, Guam, Wake Island, Palau, Marshall Islands, Kiribati, Nauru and the Federated States of Micronesia) and Polynesia (New Zealand, Hawaiian Islands, Rotuma, Midway Islands, Samoa, American Samoa, Tonga, Tuvalu, Cook Islands, French Polynesia and Easter Island).”
The AAPI community is incredibly diverse; and also one of the fastest-growing ethnic groups in the United States.
According to a census referred to by the NRCS:
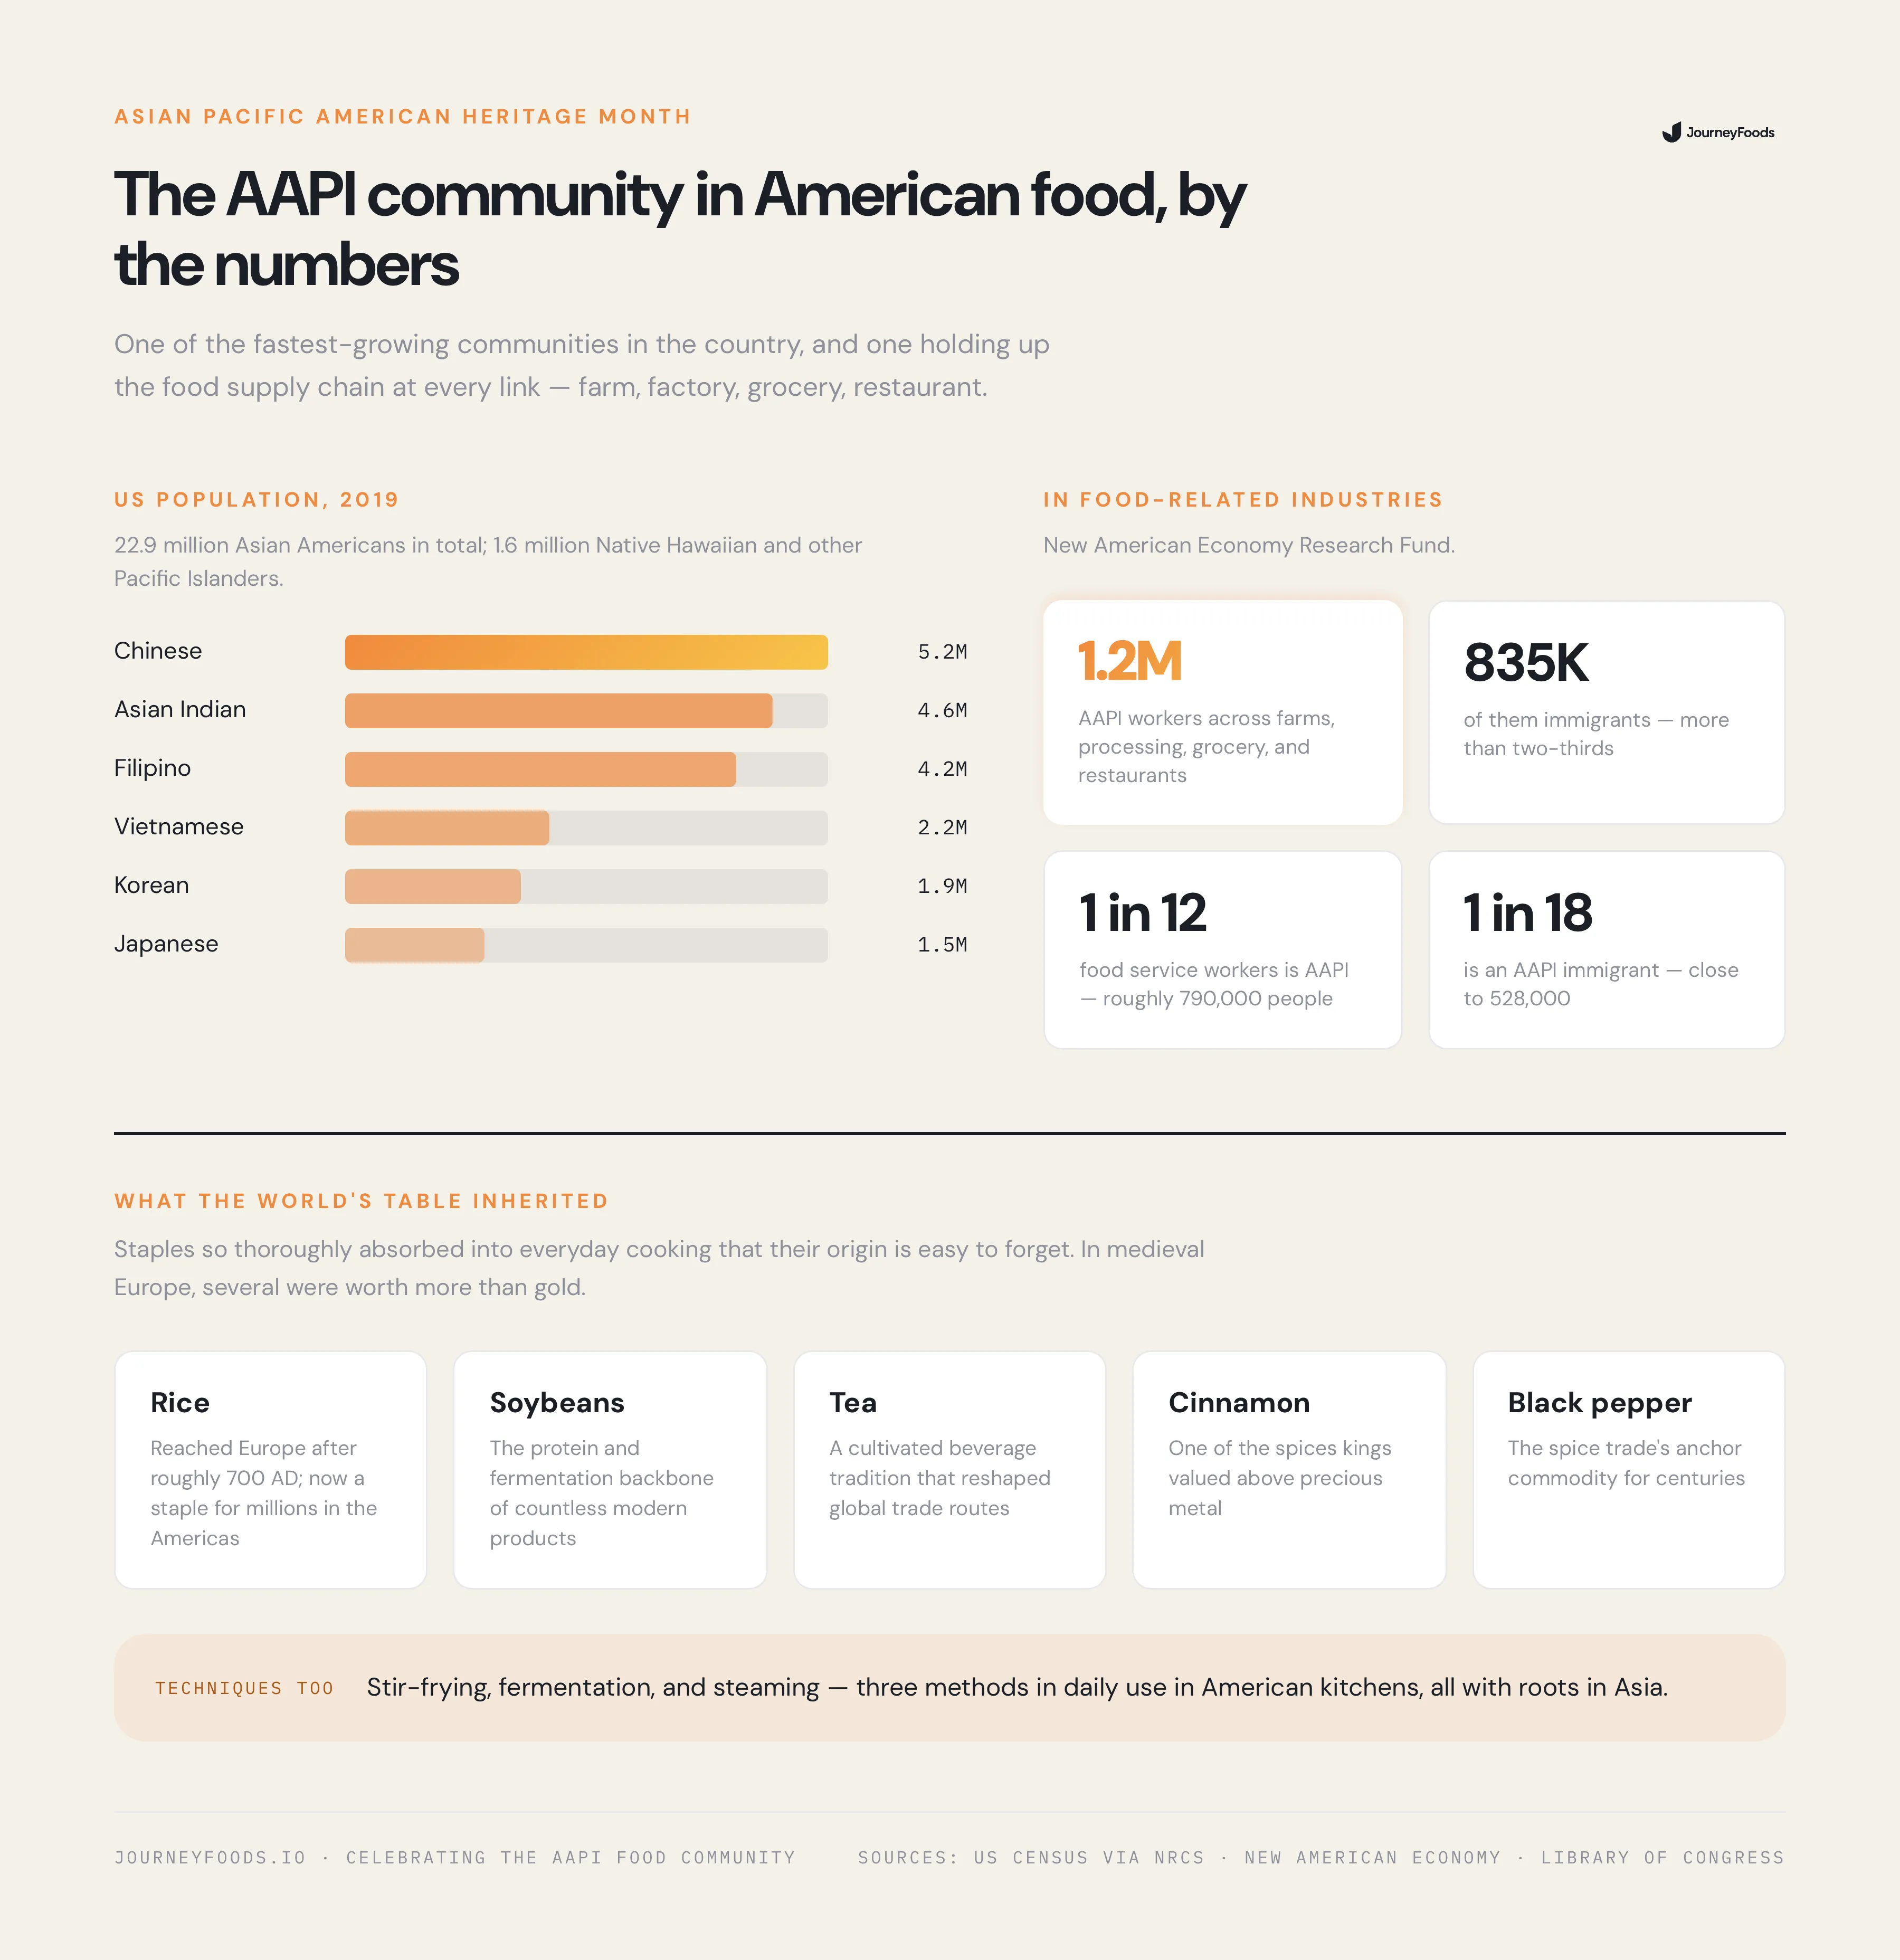
And according to the New American Economy Research Fund, “over 1.2 million AAPI workers are working in food-related industries nationwide, helping to secure the U.S. food supply chain at farms, food processing factories, grocery stores, and restaurants. More than two-thirds (almost 835,000) of these AAPI food industry workers are immigrants. In the food service industry specifically, roughly 790,000 workers (or 1 in 12) are AAPI, and close to 528,000 (or 1 in 18) are AAPI immigrants.”
AAPI Heritage Month isn’t just a nod to Asian Americans - it’s a celebration of the priceless gifts America received through the AAPI community’s perseverance and generosity.
The world of food should be eternally grateful. For centuries, the world relied on and cherished the flavors and culinary techniques AAPI countries bestowed.
The Diversity of our Fresh Foods and Spices
It’s no secret that AAPI countries/cultures/people have their thumbprint in the world of food. But since Asian-derived foods have become a staple to so many, it’s sometimes easy to forget.
Think about it…
RICE.
SOYBEANS.
TEA.
CINNAMON.
BLACK PEPPER.
The list goes on and on. But imagine the innovation that these five ingredients brought to the world’s table. It’s staggering.
Probably introduced into Europe after 700 AD, rice is one of the more important ingredients Asia shared with the world. Now, in the Americas, rice is a priceless staple for millions.
This is just the beginning. There are countless examples. In medieval Europe, many Asian spices were worth more than gold to kings, and throughout the ages, AAPI countries have brought the gift of flavor to the world. Many of the innovative stir-fry, fermentation, and steaming cooking methods that grace millions of American kitchens, find their roots in Asia.
If you want to have a bit of fun, check out this interactive map to see what food comes from where. It’s humbling to know that the foods we eat every day have been cultivated for centuries - thousands of miles away.
Supporting the AAPI Food Community
Here are some AAPI food companies to support if you’re interested. SheKnows and The Infatuation did a good job laying them out:
https://www.theinfatuation.com/products/features/asian-american-food-kitchen-brandshttps://www.sheknows.com/food-and-recipes/articles/2418775/aapi-owned-food-brands/
Some Resources Used in this Blog
We’d love to hear from you!
If you have any questions or thoughts, throw them in the comments below.
Scientist. Nutrition Leader. Founder of Journey Foods