Food Formulation
Food Formulation

Homemade Upgrade: Jell-O Instant Pudding Mix #DUP

Jell-O pudding scores a 54 for relying on additives and synthetic flavors. Homemade pudding climbs to 85, thanks to whole-food ingredients, customizable options, and far better flavor.
Jaynelle St. Jean
4 min read
May 5, 2025
vectorvectorvector
Share Article
linkfacebooktiwtter
Tags
Food Formulation
vector
Quick Answer

Jell-O pudding scores a 54 for relying on additives and synthetic flavors. Homemade pudding climbs to 85, thanks to whole-food ingredients, customizable options, and far better flavor.

vector
Key takeways
check-icon
It's an economics story. Plant-based now hits four reported metrics at once margin, scope-3, nutrition, and traceability.
check-icon
The supply base caught up. Tier-1 pea, faba, and chickpea isolates reached spec parity with whey this year.
check-icon
Speed is the unlock. A three-week supplier email chain becomes a four-minute query with ingredient intelligence.

Journey Foods Nutrition Score Breakdown
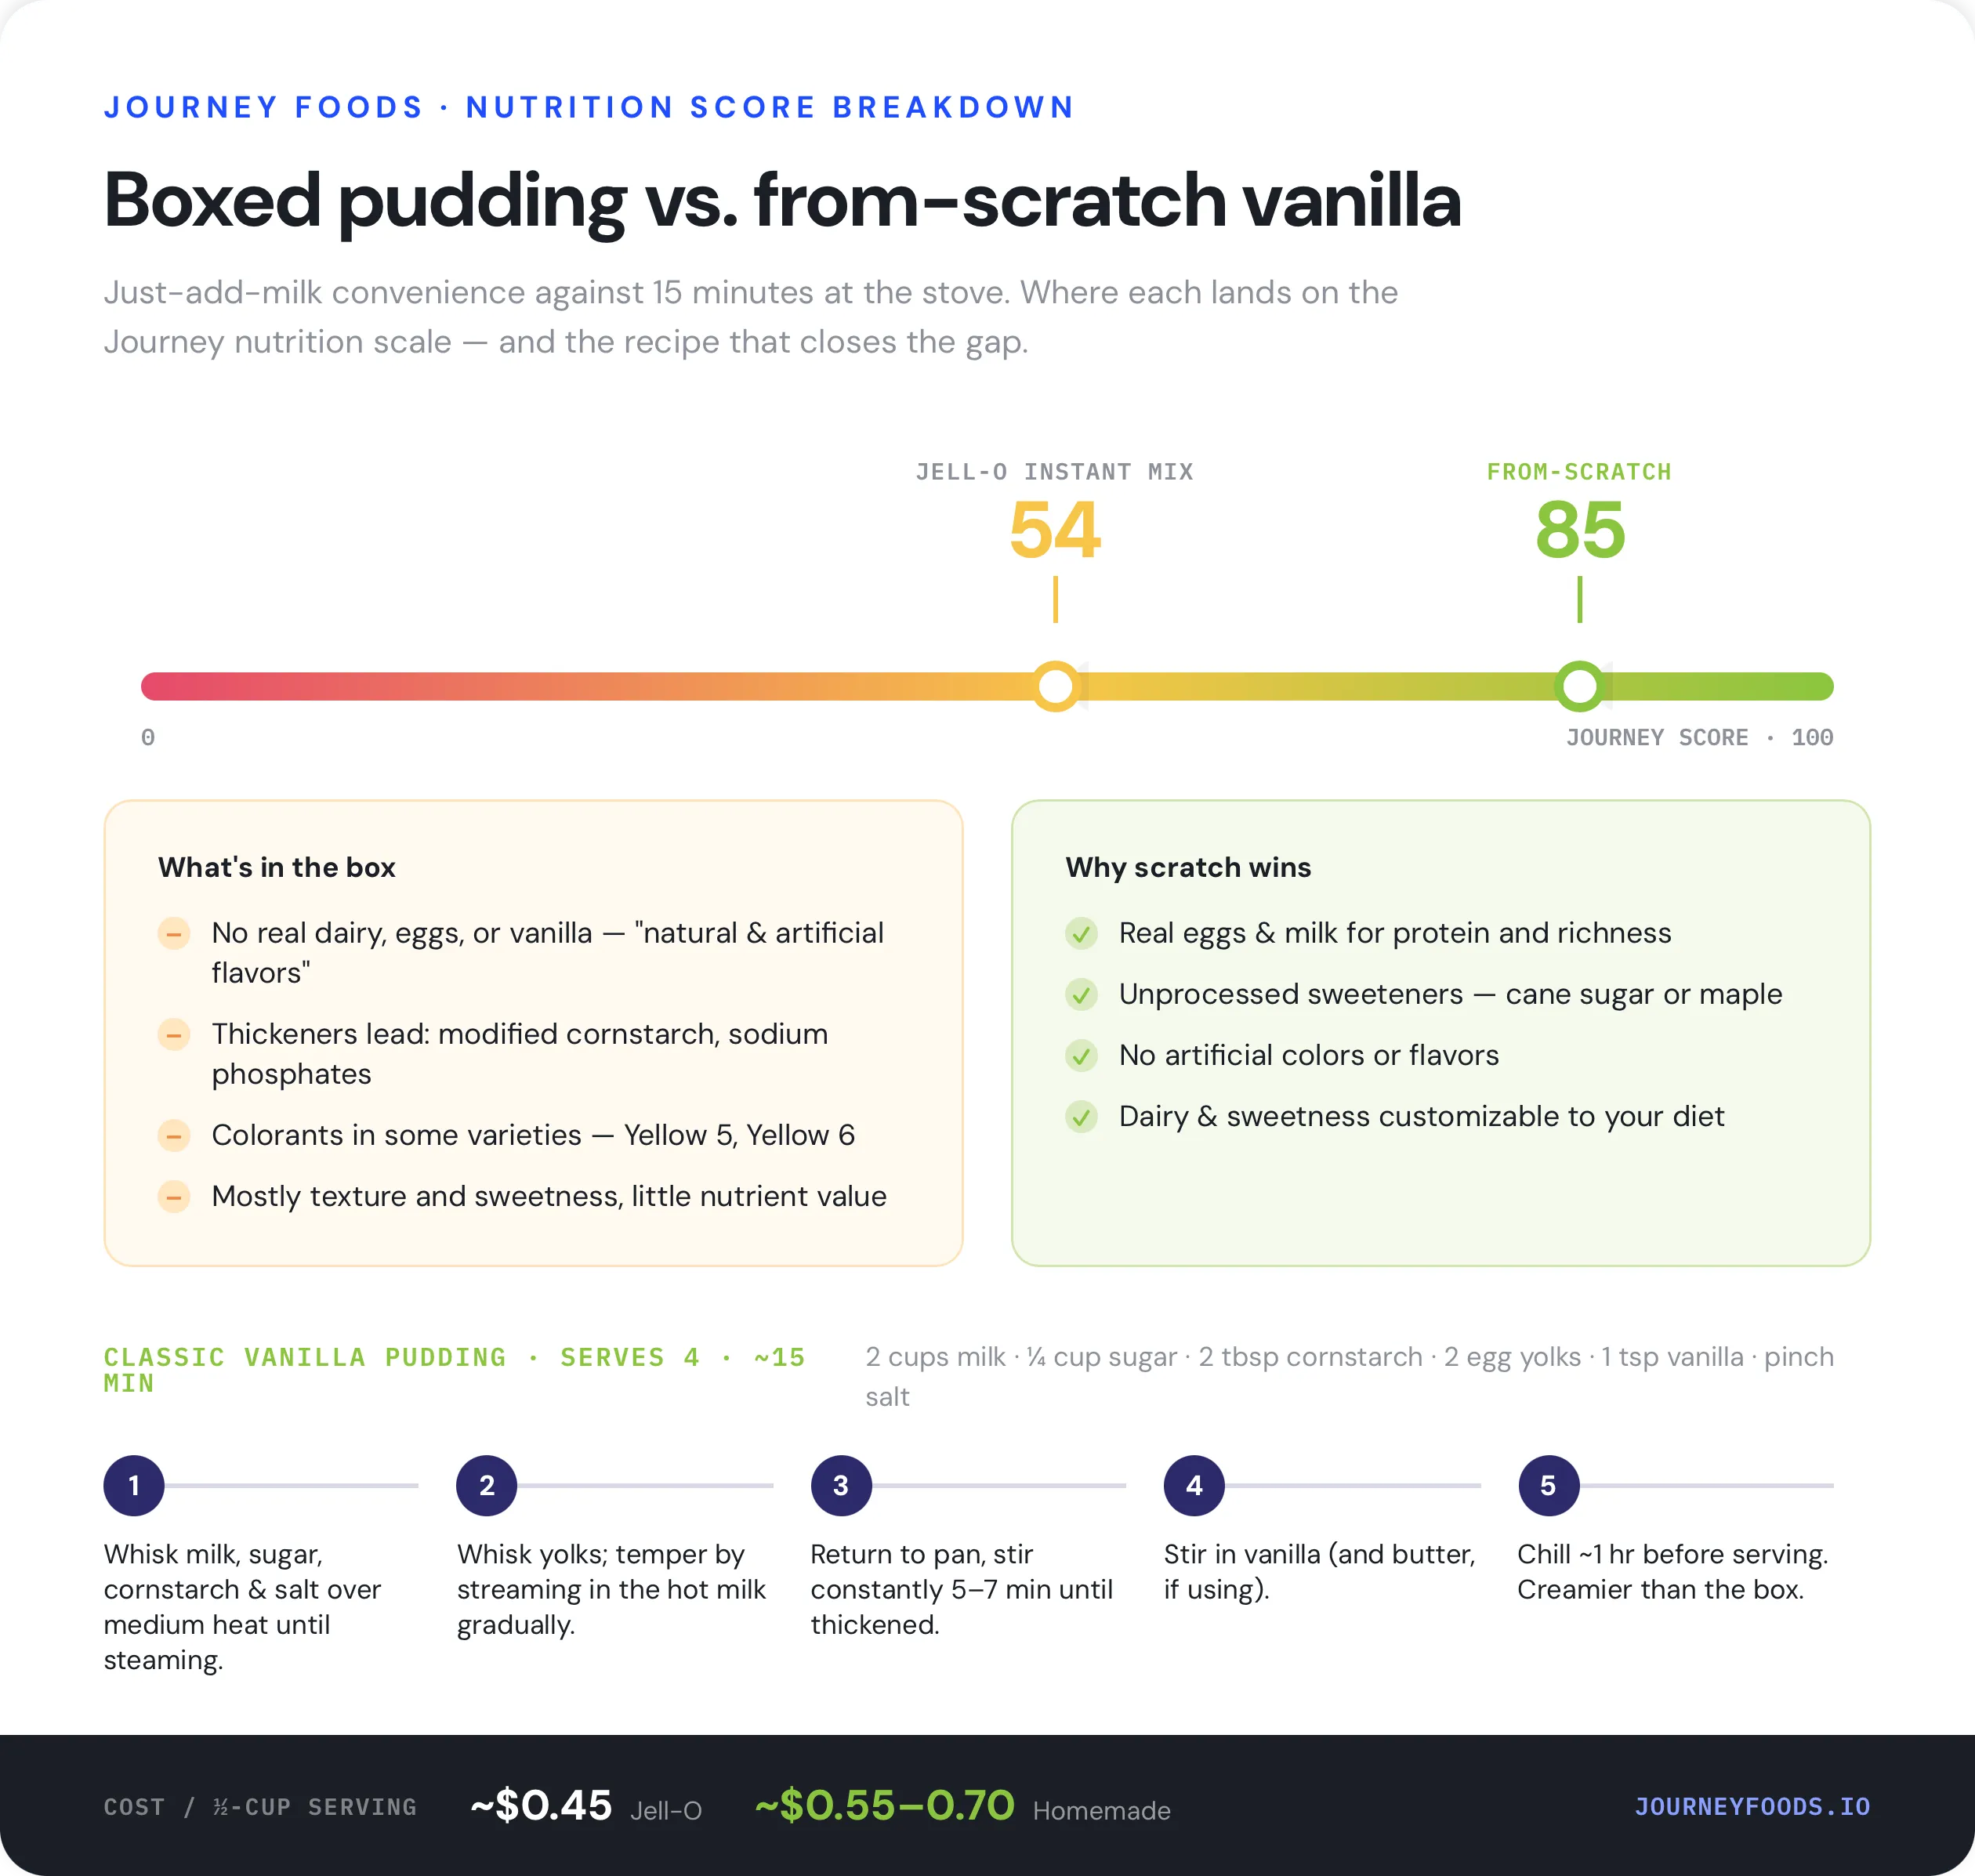
  • Jell-O Instant Vanilla Pudding Mix (prepared with 2% milk): 54/100
  • Homemade Vanilla Pudding with Egg Yolks and Milk: 85/100

What’s in the Box?

Jell-O Instant Pudding is a nostalgic dessert shortcut — just add milk and stir. But that convenience comes at the cost of real ingredients:

  • No actual dairy, eggs, or vanilla in the mix — flavor comes from “natural and artificial flavors”
  • Thickeners first: modified cornstarch, tetrasodium pyrophosphate, and disodium phosphate do the heavy lifting
  • Colorants and preservatives: includes Yellow 5 and Yellow 6 in some varieties
  • Sweetened with sugar and artificial sweeteners (varies by flavor)

All of this earns Jell-O Instant Pudding a Journey Score of 54 — highly processed, low in nutrient value, and mostly texture and sweetness.

The Homemade Swap: Real Vanilla Pudding

Making vanilla pudding from scratch takes about 15 minutes and uses simple pantry staples. The payoff? Real flavor, better texture, and a higher nutrient profile.

Why it scores higher:

  • Real eggs and milk for protein and richness
  • Unprocessed sweeteners like cane sugar or maple syrup (optional)
  • No artificial colors or flavors
  • Customize your dairy and sweetness based on dietary needs

Journey Foods Nutrition Score: 85/100
Homemade pudding wins big for ingredient quality and the absence of synthetic additives.

Homemade Recipe: Classic Vanilla Pudding

Ingredients (serves 4):

  • 2 cups whole milk (or any milk)
  • ¼ cup sugar
  • 2 tbsp cornstarch
  • 2 egg yolks
  • 1 tsp vanilla extract
  • Pinch of salt
  • Optional: knob of butter for extra richness

Instructions:

  1. In a saucepan, whisk milk, sugar, cornstarch, and salt over medium heat until steaming.
  2. In a bowl, whisk yolks. Gradually whisk in hot milk to temper.
  3. Return mixture to the pan and cook, stirring constantly, until thickened (about 5–7 minutes).
  4. Stir in vanilla (and butter if using). Chill before serving.

Time Breakdown:

  • Active Time: 10–15 minutes
  • Inactive Time: 1 hour chill time (optional)

Cost Comparison (per ½-cup serving)

Option

Cost per Serving

Jell-O Instant Pudding (w/ milk)

~$0.45

Homemade Vanilla Pudding

~$0.55–$0.70

Homemade costs a bit more, but delivers richer flavor, better fats, and no questionable additives.

Final Take

Jell-O mix is fast and familiar, but it’s far from a whole-food dessert. Homemade pudding offers real vanilla, protein from eggs, and none of the artificial stuff — with a noticeably creamier texture and better nutritional profile.

About the Author
Jaynelle St. Jean

Frequently asked questions

Structured Q&A  marked up with FAQ Page schema so it can be surfaced and cited by Al engines and search.

Is plant based reformulation actually cheaper than 
animal protein?

In Journey Al's 12 month dataset, the median plant protein reformulation came in -6.5% on raw material cost versus an animal protein control the first year that line went negative, driven by Tier 1 isolate suppliers reaching spec parity.

How much does plant based reformulation improve 
nutrition scores?

In Journey Al's 12 month dataset, the median plant protein reformulation came in -6.5% on raw material cost versus an animal protein control the first year that line went negative, driven by Tier 1 isolate suppliers
reaching spec parity.

What's the supply chain risk of switching?

In Journey Al's 12 month dataset, the median plant protein reformulation came in -6.5% on raw material cost versus an animal protein control the first year that line went negative, driven by Tier 1 isolate suppliers
reaching spec parity.

back-to-top