Fruit Fiber Rankings: Which Fruits Actually Deliver the Most Dietary Fiber Per Serving

Quick answer
Quick Answer: Most fruits marketed as "high-fiber" deliver between 1 and 4 grams per standard serving. A small group — avocado, guava, passion fruit, raspberries, and blackberries — consistently hits 4 to 9 grams per serving. Those are the only fruits worth anchoring a fiber claim around. Everything else is background noise.
Meta description: A ranked fruit fiber list with per-serving data for R&D leads and CPG formulators — find out which fruits actually deliver on fiber claims before you finalize your formulation.
Key Takeaways:
Why the Fruit Fiber List Most People Use Is Wrong
You've seen the charts. Pears at the top, apples right behind them, maybe a nod to bananas. They're not wrong, exactly — but they weren't built for product development decisions.
Most fruit fiber rankings are written for consumers making grocery choices. They rank by 100g, ignore realistic serving sizes, and treat fresh, dried, and juiced forms as interchangeable. Fine for a health blog. A real problem if you're formulating a bar, a smoothie pouch, or a functional beverage and need to know whether your fruit inclusion actually supports a fiber claim.
This article ranks fruits the way a formulator should think about them: grams of dietary fiber per standard serving, with notes on form and concentration. If you're a food scientist or R&D lead evaluating ingredients, this is the fruit fiber list built for your workflow — not a consumer's shopping cart.
The Rankings: Dietary Fiber Per Standard Serving
Serving sizes below follow FDA reference amounts customarily consumed (RACCs) where applicable. Where no RACC exists, a realistic single-serving portion is used. All fiber values are total dietary fiber (soluble + insoluble).
Tier 1: 5g or More Per Serving (Excellent Source)
These are the fruits that can anchor an "excellent source of fiber" claim. There aren't many.
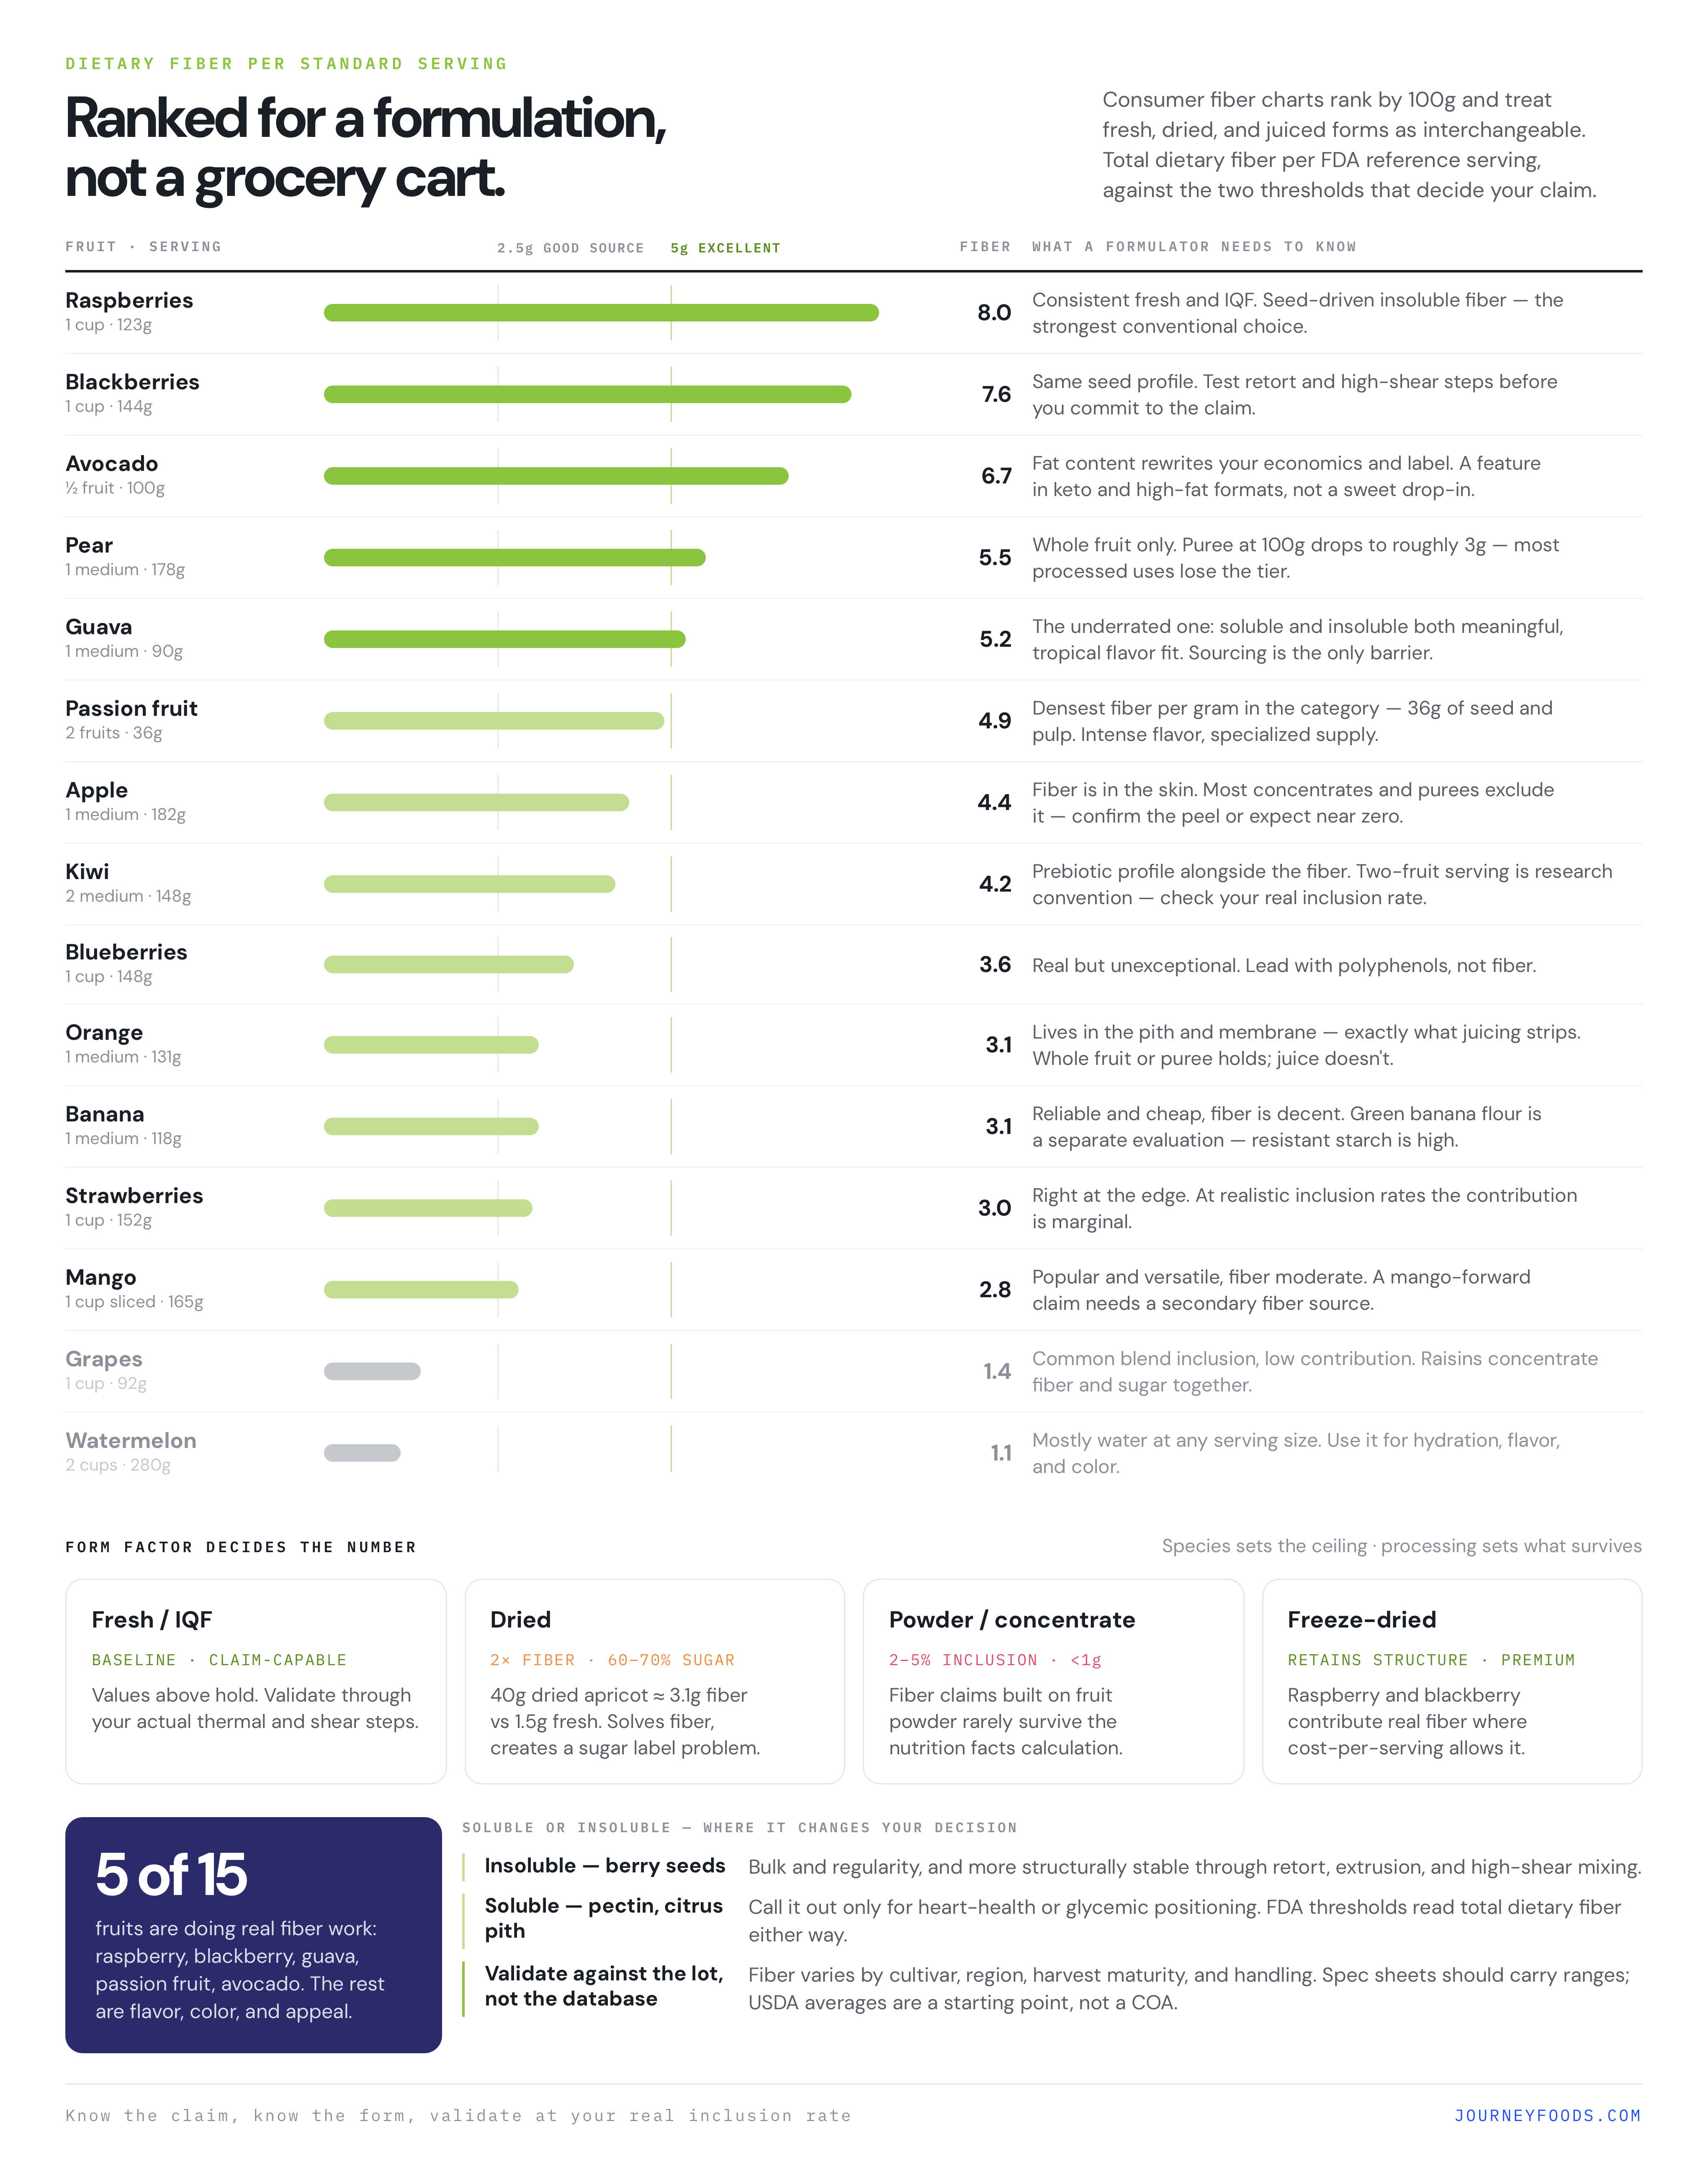
Avocado (half fruit, ~100g): 6.7g fiber
Avocado is the outlier in this tier. It's technically a fruit, and its fiber profile is genuinely strong. The catch: it's also high in fat, which changes your formulation economics and label positioning entirely. It works in savory applications and some functional formats — it's not a drop-in for sweet products.
Guava (1 medium, ~90g): 4.9–5.4g fiber
Guava is underused in Western CPG and punches well above its weight on fiber. It also carries a favorable flavor profile for tropical and functional formats. If your supply chain can support it, guava deserves more attention than it gets.
Passion fruit (2 fruits, ~36g): 4.9g fiber
Passion fruit is almost entirely seed and pulp — which is exactly where the fiber lives. Per gram, it's one of the densest fruit fiber sources in the category. The serving size is small, the flavor is intense, and sourcing is specialized. But the fiber numbers are real.
Raspberries (1 cup, ~123g): 8g fiber
Raspberries are the strongest performer in the conventional berry category. Eight grams per cup is consistent across fresh and IQF forms. The seeds contribute meaningfully to insoluble fiber, which matters if you're targeting gut health positioning.
Blackberries (1 cup, ~144g): 7.6g fiber
Close behind raspberries, with a similar seed-driven fiber profile. Both berries hold up reasonably well in processing, though heat treatment and high-shear mixing can degrade some fiber structure — worth testing before you finalize a claim.
Tier 2: 3–4.9g Per Serving (Good Source)
This tier clears the FDA "good source" threshold of 2.5g. These fruits can support a fiber claim, but none of them will carry a product on fiber alone.
Pear (1 medium, ~178g): 5.5g fiber
A full medium pear actually lands in Tier 1 — but most formulation uses involve pear puree or concentrate at lower inclusion rates. At a 100g serving of puree, you're looking at roughly 3g. Strong for whole-fruit formats; weaker in processed applications.

Journey Ingredient Intelligence
Avocado
Avocado (half fruit, ~100g): 6.7g fiber Avocado is the outlier in this tier.
A plant (Persea americana) high in healthy fats and nutritional value.
Apple (1 medium, ~182g): 4.4g fiber
Apple's fiber is heavily concentrated in the skin. Peeled apple or clarified apple juice contributes almost nothing. If you're using apple in a formulation and expecting fiber contribution, confirm whether your ingredient includes the peel. Most apple concentrates and purees do not.
Kiwi (2 medium, ~148g): 4.2g fiber
Kiwi is gaining traction in functional food for its prebiotic profile alongside its fiber content. The skin is edible and adds fiber, though most formulations exclude it. A two-kiwi serving is standard in consumer research but may not match your actual inclusion rate.
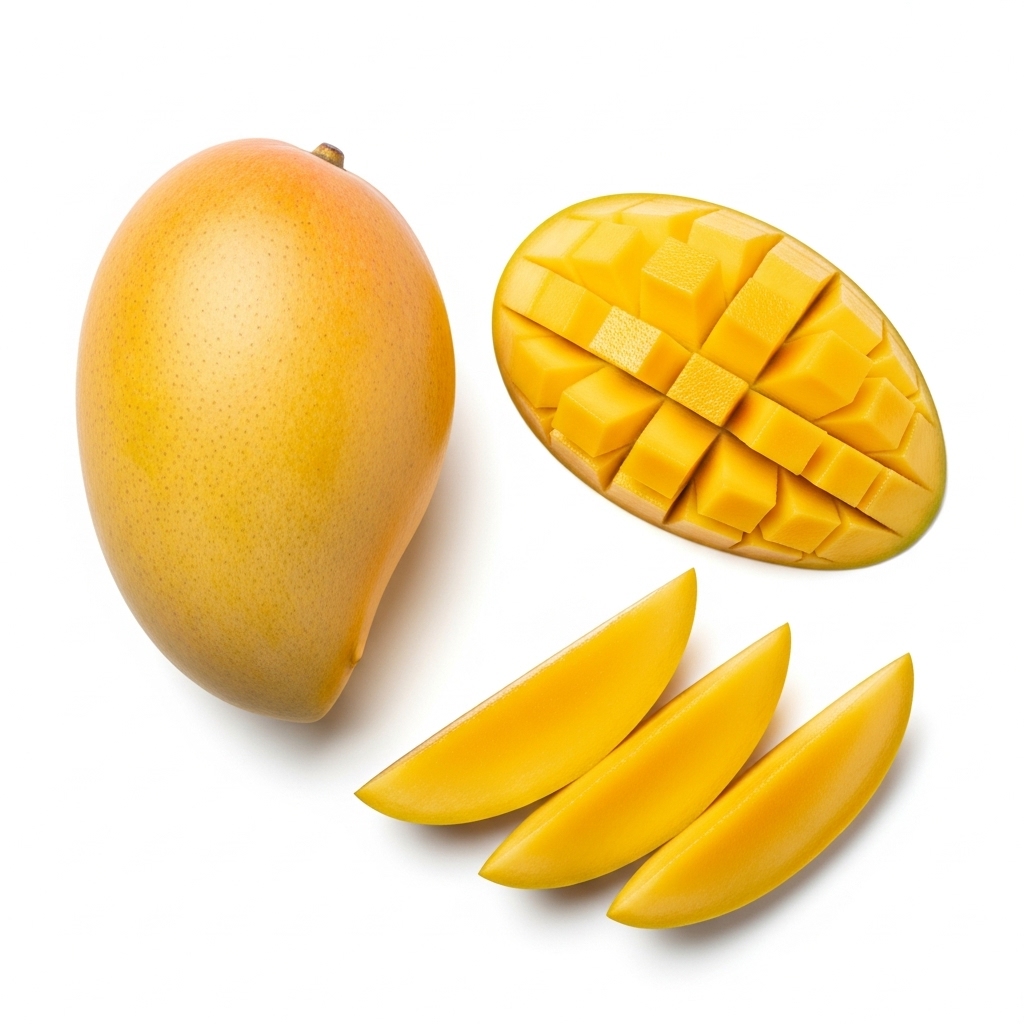
Mango (1 cup sliced, ~165g): 2.6–3g fiber
Mango is popular, widely available, and versatile. Its fiber contribution is moderate. If you're formulating a mango-forward product and want to support a fiber claim, you'll likely need a secondary fiber source to get there.
Orange (1 medium, ~131g): 3.1g fiber
Orange's fiber lives almost entirely in the pith and membrane — the parts that get stripped in juice processing. Orange juice contributes negligible fiber. Whole-fruit or puree formats hold the numbers. Juice doesn't.
Tier 3: Under 2.5g Per Serving (Below Good Source Threshold)
These fruits are valuable for flavor, color, antioxidants, and consumer appeal. They are not fiber ingredients.
Strawberries (1 cup, ~152g): 3g fiber
Strawberries sit right at the edge of the good source threshold. They're often cited as a fiber source, but at typical formulation inclusion rates, the contribution is marginal.
Blueberries (1 cup, ~148g): 3.6g fiber
Blueberries are frequently positioned as a superfruit, and their antioxidant profile justifies that. Their fiber content is real but not exceptional. Don't lead with fiber if you're formulating with blueberries — lead with polyphenols.
Banana (1 medium, ~118g): 3.1g fiber
Bananas are a reliable, cost-effective ingredient. Fiber content is decent but not remarkable. Green banana flour is a different story — resistant starch content is high and worth a separate evaluation if fiber is your primary objective.
Watermelon (2 cups, ~280g): 1.1g fiber
Watermelon is mostly water. The fiber numbers are low regardless of how you slice the serving. It belongs in your formulation for hydration positioning, flavor, and color — not fiber.
Grapes (1 cup, ~92g): 1.4g fiber
Grapes are a common inclusion in blended products. Fiber contribution is low. Raisins deliver more fiber per gram but come with significant sugar concentration — a different set of label tradeoffs.
Fresh vs. Dried vs. Concentrated: The Form Factor Problem
This is where most fruit fiber lists fail formulators. Form matters as much as species.
Dried fruit concentrates fiber per gram because water is removed. A 40g serving of dried apricots delivers roughly 3.1g of fiber. The same weight of fresh apricots delivers about 1.5g. The math favors dried — but so does the sugar concentration. Dried fruit typically runs 60–70% sugar by weight. If your product targets low-sugar positioning, dried fruit creates a label problem even as it solves a fiber problem.
Fruit powders and concentrates vary enormously. Spray-dried fruit powders often retain most of the fiber from the original fruit, but typical inclusion rates in a finished product run 2–5% by weight. At that rate, even a high-fiber fruit powder contributes under 1g of fiber per serving. Fiber claims built on fruit powder inclusions rarely survive a nutrition facts calculation.
Freeze-dried fruit retains fiber well and maintains more of the original structure than spray drying. It's also significantly more expensive. For premium formats where cost-per-serving allows it, freeze-dried raspberry or blackberry can be a legitimate fiber contributor at meaningful inclusion rates.
For a deeper look at how fiber content varies across ingredient forms and what thresholds actually support a CPG claim, the fiber content reference for high-fiber ingredient choices on the Journey Foods blog breaks this down by ingredient category.

Journey Ingredient Intelligence
Passionfruit
Passion fruit (2 fruits, ~36g): 4.9g fiber Passion fruit is almost entirely seed and pulp — which is exactly where the fiber lives.
A South American tree in the family Lecythidaceae.
Soluble vs. Insoluble: Does the Split Matter for Your Label?
For most fiber claims, total dietary fiber is what counts. The FDA "good source" and "excellent source" thresholds don't distinguish between soluble and insoluble fiber.
But the split matters for product positioning and consumer communication.
Soluble fiber — found in higher concentrations in apples (pectin), citrus pith, and guava — dissolves in water, forms a gel in the gut, and is associated with cholesterol management and blood sugar regulation. If your product targets heart health or glycemic positioning, soluble fiber content is worth calling out specifically.
Insoluble fiber — dominant in raspberries, blackberries, and most berry seeds — adds bulk, supports regularity, and is what most consumers associate with "digestive health." It's also more structurally stable through processing, which matters if your product goes through retort, extrusion, or high-shear mixing.
Most fruits deliver a mix of both. Raspberries and blackberries skew insoluble. Apples and citrus skew soluble. Guava delivers a meaningful amount of both — part of why it deserves more attention in functional food development.
What This Means for Formulation Decisions
If you're building a product with a fiber claim, this fruit fiber list narrows your real options quickly.
Raspberries and blackberries are your strongest conventional choices for a high-fiber fruit inclusion. Available in IQF and freeze-dried forms, they hold up reasonably well in most processing environments, and the fiber numbers are consistent.
Guava is the underrated option. Supply chain complexity is the main barrier — but if your sourcing team can establish a reliable supply, the fiber-to-flavor ratio is hard to beat in tropical and functional formats.
Avocado works in the right product category. The fat content is a feature, not a bug, in keto and high-fat functional formats, and the fiber contribution is real.
Everything else in the fruit category should be evaluated for what it actually contributes: flavor, color, antioxidants, consumer appeal. Those are legitimate reasons to use a fruit ingredient. Fiber just isn't the reason for most of them.
If you're tracking multiple fruit ingredients across a formulation and need to model how different inclusion rates affect your nutrition panel, Journey Foods lets you score and compare ingredients across nutrition, cost, and sustainability criteria in one place — so you're not rebuilding the same spreadsheet every time a supplier changes.
For context on how ingredient labels communicate fiber and other nutritional claims to consumers, the ingredient label analysis for 2026 covers what shoppers are actually reading and what that means for how you position your product.
A Note on Produce Quality and Supply Chain Consistency
Fiber content in fruit isn't fixed. It varies by variety, growing region, harvest maturity, and post-harvest handling. A raspberry grown in Chile in January and one grown in Oregon in July are the same species — not the same ingredient.
Journey Ingredient Intelligence
Bananas
Pears at the top, apples right behind them, maybe a nod to bananas.
A sweet fruit (Musa acuminata) high in potassium that can be dried, blended, mashed, etc.
This variability is why spec sheets from suppliers should always include fiber ranges, not single values. Your formulation should be validated against the actual ingredient lot, not a USDA database average. The USDA database is a useful starting point. It's not a substitute for supplier COAs.
For context on how produce quality and freshness affect ingredient performance across the supply chain, the science of fruit freshness piece is worth reading alongside this ranking.
The Short List
The fruit fiber list that actually matters for product development is shorter than most people expect. Raspberries, blackberries, guava, passion fruit, and avocado are doing real work. Everything else is a supporting player.
Know what claim you're trying to support. Know what form your fruit ingredient is actually in. Validate against your real inclusion rate — not a per-100g database number. The difference between a product that clears a fiber claim and one that doesn't usually comes down to those three variables.
If you're evaluating fruit ingredients alongside other fiber sources, Journey Foods gives your R&D team a single environment to search, score, and compare across nutrition, cost, and supply chain criteria — without rebuilding the analysis every time something changes upstream.
FAQs
What fruit has the most fiber per serving?
Raspberries deliver approximately 8 grams of dietary fiber per cup (123g), making them the highest-fiber conventional fruit by standard serving. Avocado (half fruit, ~100g) delivers about 6.7g; blackberries deliver roughly 7.6g per cup. Passion fruit is the densest source per gram, but the serving size is small.
Which fruits qualify as an "excellent source" of fiber under FDA rules?
To carry an "excellent source of fiber" claim, a food must deliver at least 5 grams of dietary fiber per serving. At standard serving sizes, raspberries, blackberries, avocado, and a full medium pear consistently meet this threshold. Most other fruits fall below it.
Does drying fruit increase its fiber content?
Drying concentrates fiber per gram because water is removed, so dried fruit delivers more fiber per gram than fresh. It also concentrates sugar significantly. A 40g serving of dried apricots delivers roughly 3g of fiber but carries a high sugar load — a tradeoff that affects both the nutrition panel and your product's label positioning.
Why does apple fiber disappear in juice and concentrate?
Apple's fiber is concentrated in the skin and pulp. Clarified apple juice and most apple concentrates remove both, leaving almost no fiber. If you need apple's fiber contribution in a formulation, you need whole apple puree or a product that retains the peel — not juice.
Is soluble or insoluble fiber better for a gut health claim?
Both are associated with gut health, but they work differently. Insoluble fiber (dominant in raspberries and blackberries) supports regularity. Soluble fiber (higher in apples and citrus) feeds beneficial gut bacteria and is associated with prebiotic effects. For a general digestive health claim, total dietary fiber is what the FDA evaluates. For more specific microbiome positioning, soluble fiber content is the more relevant figure.
Can fruit powder inclusions support a fiber claim?
Rarely, at typical inclusion rates. Most formulations use fruit powder at 2–5% by weight. Even a high-fiber fruit powder at that rate contributes under 1 gram of fiber per serving — well below the 2.5g threshold for a "good source" claim. Fiber claims built on fruit powder usually require a dedicated fiber ingredient alongside the fruit for flavor.
How much does fiber content vary between fruit varieties and growing regions?
Meaningfully. USDA database averages are useful benchmarks, but actual fiber content varies by cultivar, growing region, harvest maturity, and post-harvest handling. Always validate fiber content against supplier certificates of analysis for the specific lot you're using — not a generic database value.
Journey Ingredient Intelligence
Mango
Mango (1 cup sliced, ~165g): 2.6–3g fiber Mango is popular, widely available, and versatile.
An edible legume, known for its lens-shaped seeds.
As published
70%
Journey Ingredient Intelligence · Comparison
Avocado
Passionfruit
Data from this story
Shareable Journey Intelligence
Fruit Fiber Rankings: Which Fruits Actually Deliver the Most Dietary Fiber Per Serving
Ingredients
70%
Dried fruit typically runs 60–70% sugar by weight.
5%
Spray-dried fruit powders often retain most of the fiber from the original fruit, but typical inclusion rates in a finished product run 2–5% by weight.