.svg)
.svg)
.svg)
.svg)


.svg)
Fiber is having a moment in CPG product development, and not just because consumers are reading labels more carefully. Regulatory pressure, clean-label trends, and retailer shelf standards are all pushing R&D teams to think harder about fiber content in food formulations. The challenge is that "high-fiber" is easy to say and genuinely difficult to execute without compromising texture, taste, cost, or shelf stability.

.svg)
This reference is written for food scientists and R&D leads making real formulation decisions. It covers the most useful high-fiber ingredients by category, their functional trade-offs, fiber content benchmarks, and the formulation considerations that rarely show up in a supplier spec sheet.
In the US, the FDA defines "high fiber" as 20% or more of the Daily Value per serving — that's 5.6g based on the 28g DV for adults. "Good source of fiber" starts at 10% DV (2.8g per serving).
These thresholds matter beyond marketing. They affect shelf placement, retailer scoring systems, and which health-positioning claims you can actually make. Hitting 5.6g per serving sounds straightforward until you factor in serving size, water activity, and the sensory profile of the ingredients getting you there.
One distinction worth keeping close: soluble vs. insoluble fiber. Soluble fiber (beta-glucan, pectin, inulin) dissolves in water, forms gels, and tends to affect texture more noticeably. Insoluble fiber (cellulose, wheat bran, some resistant starches) adds bulk and can create grittiness or off-mouthfeel if not managed carefully. Most high-performing fiber formulations use a blend of both.
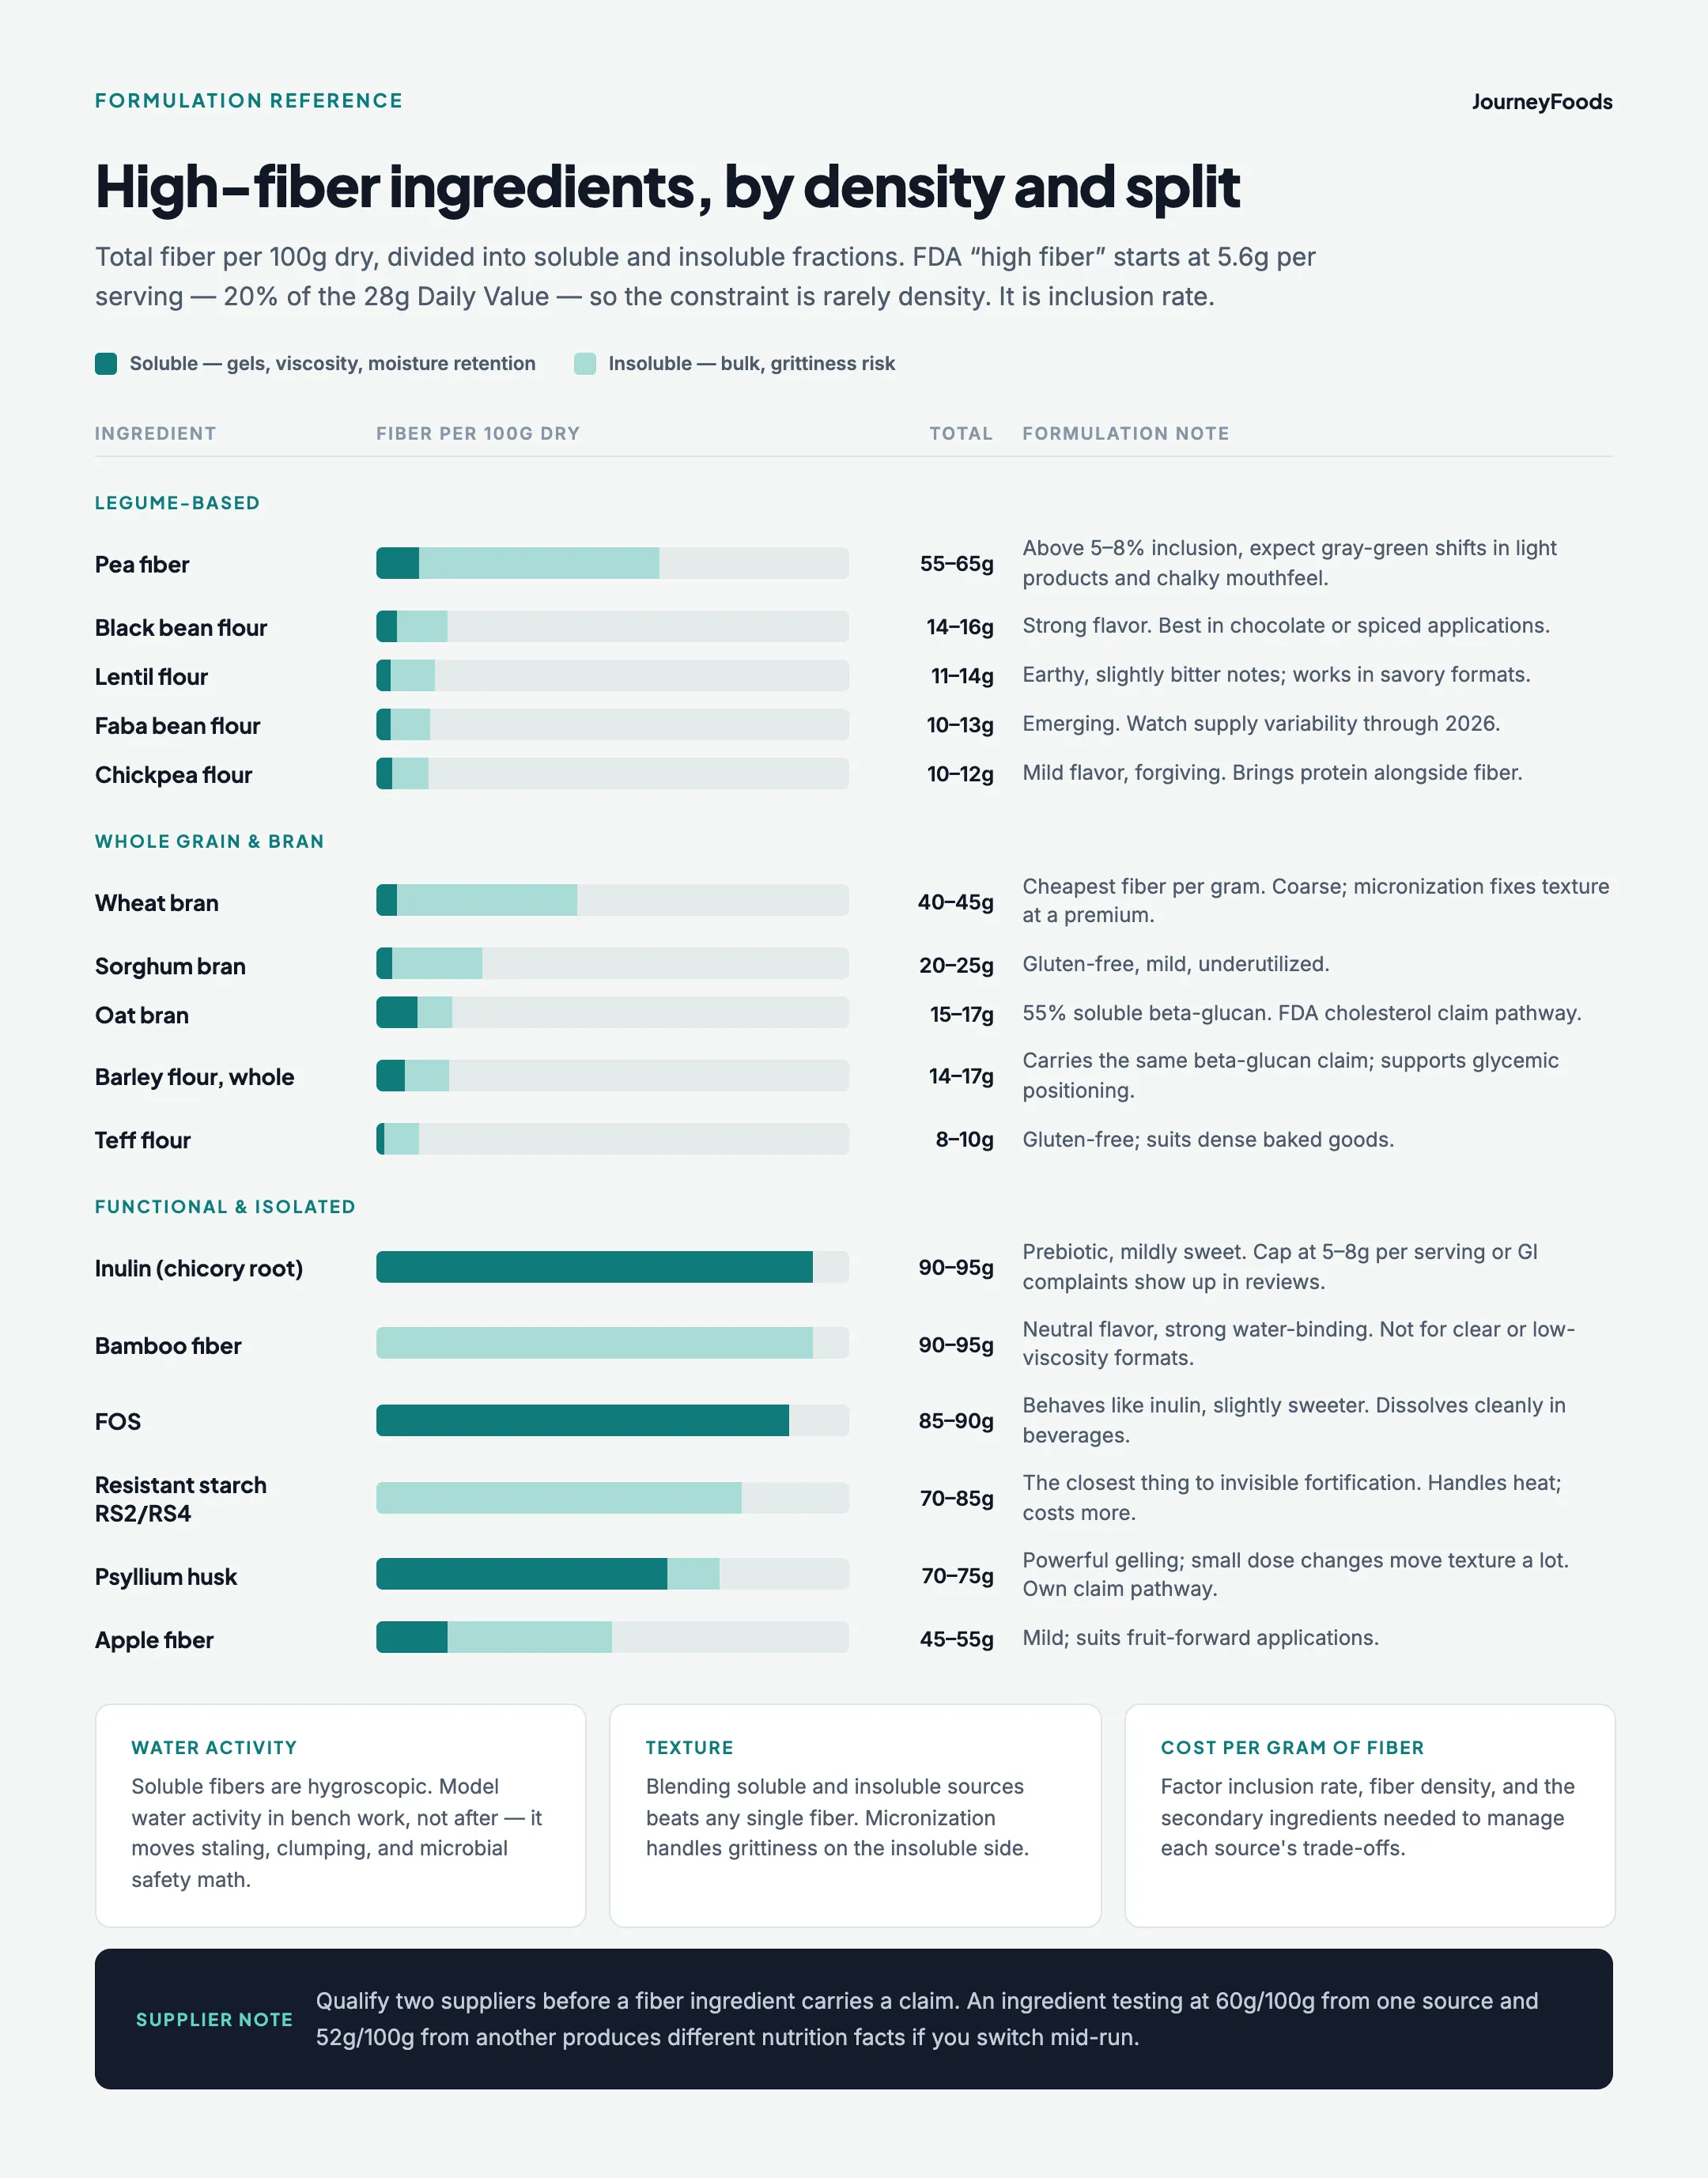
Legume flours and protein concentrates are among the most efficient fiber delivery vehicles available right now.
Pea fiber is the standout for pure fiber density, but it comes with real constraints. At inclusion rates above 5–8%, expect color shifts (gray-green tones in light-colored products) and a chalky mouthfeel. Chickpea and lentil flours are more forgiving and bring protein alongside fiber, which helps nutritional positioning.
Oat bran is the most commercially proven ingredient in this category. The FDA-approved health claim linking beta-glucan to reduced cholesterol risk gives you a claim pathway that few other ingredients can match — barley carries the same claim. If heart-health positioning is part of the brief, these two are your starting point.
Wheat bran delivers the highest fiber density in this group, but its coarse particle size and insoluble-heavy profile make it difficult in anything requiring a smooth texture. Micronized wheat bran improves this significantly, though at a cost premium.
This is where formulation gets more precise, and where supplier claims need the most scrutiny.
Inulin is the workhorse of functional fiber fortification. Nearly flavorless at low doses, it contributes mild sweetness that can reduce added sugar slightly and carries prebiotic positioning. The catch is dose-dependent GI discomfort — most formulators cap inulin at 5–8g per serving in finished products to stay on the right side of consumer tolerance. Go above that and you will see complaints in reviews.
Resistant starch, particularly RS4 (chemically modified), is the closest thing to an invisible fiber ingredient. Minimal flavor, minimal texture change, and it handles heat processing well. It costs more than commodity fibers, but for applications where texture is non-negotiable, it often pays for itself by reducing reformulation cycles.
Psyllium husk is powerful but demanding. Small changes in inclusion rate or hydration can dramatically alter finished product texture. It is worth the effort in products where you can position the fiber source prominently on the label — bars, cereals, and functional beverages are the natural fits.
High-fiber ingredients, especially soluble fibers, are hygroscopic. They attract and bind water, which can accelerate staling in baked goods, cause clumping in powder formats, and shift water activity in ways that affect microbial safety calculations. Any time you add a new fiber ingredient at meaningful inclusion rates, water activity modeling belongs in the bench work, not as an afterthought.
Insoluble fibers add bulk and can create grittiness. Soluble fibers can produce gumminess or sliminess at higher doses. The interaction between fiber type, particle size, and the rest of your ingredient matrix determines whether the finished texture is acceptable. Particle size reduction (micronization) helps with insoluble fibers. Blending soluble and insoluble sources typically produces better results than relying on a single fiber ingredient.
Most isolated fibers are relatively neutral, but legume-based and whole grain fibers carry flavor. Lentil flour has earthy, slightly bitter notes. Wheat bran has a distinctive "bran" character consumers recognize immediately. Oat bran has a mild sweetness. None of these are problems if your application suits them, but they require flavor masking or profile adjustment in neutral or sweet formats.
This calculation gets skipped in early formulation more often than it should, and it matters when you are comparing options at scale. Wheat bran delivers fiber at very low cost per gram. Inulin and resistant starch cost significantly more per gram of fiber delivered. Psyllium husk sits in the middle. Your cost-per-gram-of-fiber calculation should factor in inclusion rate, fiber density, and any secondary ingredients required to manage the functional trade-offs of that fiber source.
For teams managing ingredient cost alongside nutritional goals, food ingredient cost optimization frameworks can help structure that analysis across your full formulation.
The bar format is forgiving for fiber fortification — density and chewiness are expected. Inulin, oat bran, and pea fiber all work well here. Psyllium husk can be used at moderate levels. Watch for binding behavior changes when switching fiber sources, especially if your bar uses a syrup-based binder.
Soluble fibers dominate here. Inulin and FOS dissolve cleanly. RS4 resistant starch disperses well. Psyllium husk is problematic in beverages unless the product is specifically designed around its gelling behavior. Bamboo fiber and pea fiber do not work well in clear or low-viscosity formats.
The most complex application for fiber fortification. You are managing gluten network effects, water absorption, browning, and texture simultaneously. Oat bran, wheat bran, and whole grain flours are the most established choices. Inulin at low doses (3–5%) can improve moisture retention and extend shelf life. Resistant starch is useful for invisible fortification but does not contribute to structure.
Legume flours — lentil, chickpea, faba bean — are the most common fiber sources in alternative pasta. They contribute protein alongside fiber, which supports dual nutritional positioning. Texture management is the primary challenge, particularly maintaining al dente bite after cooking.
One of the less visible problems in CPG product development is that fiber content data lives in disconnected places. Supplier spec sheets, internal formulation spreadsheets, and nutrition calculation tools rarely talk to each other. When you change a supplier for a fiber ingredient, the nutritional profile of your finished product can shift without anyone catching it until a label review or a retailer audit.
This is where centralized formulation management becomes practically important, not just organizationally convenient. Journey Foods lets teams track ingredient-level nutritional data — including fiber content — alongside cost and supply chain status in a single workspace. The Operations Scientist AI scores ingredients across nutrition, cost, and sustainability simultaneously, so a fiber ingredient swap gets evaluated on all three dimensions before it reaches a reformulation decision.
If you are managing multiple SKUs with fiber claims, or if fiber content is a core part of your product's positioning, the risk of a silent reformulation error is real. Version-controlled formulation tracking is the operational safeguard against it.
For a broader view of where fiber fits among the ingredient trends R&D teams are prioritizing this year, see 5 ingredient trends CPG R&D teams are tracking in 2026.
Functional fibers — inulin and resistant starch in particular — have seen meaningful supply variability over the past few years. Chicory root, the primary inulin source, is subject to agricultural yield variability and European supply concentration. Pea fiber supply has expanded, but quality consistency across suppliers varies more than the commodity price suggests.
Before committing to a fiber ingredient as a core component of a product's nutritional claim, qualify at least two suppliers. Understand the specification range each supplier holds, not just the nominal value. An ingredient that tests at 60g/100g from one supplier and 52g/100g from another will produce different finished-product nutrition facts if you switch sources mid-production run.
That kind of discrepancy is exactly what proactive supply chain monitoring is designed to catch before it becomes a labeling problem.
What is considered a high-fiber food under FDA labeling rules?
A food can be labeled "high fiber" or "excellent source of fiber" if it contains 20% or more of the Daily Value per serving — 5.6g or more based on the 28g DV for adults.
Which fiber ingredient has the highest fiber density by weight?
Inulin, bamboo fiber, and FOS all deliver 85–95g of fiber per 100g of dry ingredient, making them the most concentrated sources available to formulators. Inclusion rates are limited by functional and sensory constraints, not fiber density.
What is the difference between soluble and insoluble fiber in formulation?
Soluble fiber dissolves in water, forms gels, and affects texture, viscosity, and moisture retention. Insoluble fiber adds bulk and can create grittiness. Most high-performing formulations blend both types to balance fiber content with acceptable texture.
How do I avoid GI complaints from fiber fortification?
The most common culprit is fermentable soluble fiber — inulin and FOS — at high doses. Keeping inulin below 8g per serving in finished products reduces the risk significantly. Resistant starch and insoluble fibers are generally better tolerated at higher inclusion rates.
Can I use resistant starch to hit a fiber claim without changing product texture?
RS4 (cross-linked resistant starch) has minimal impact on texture and flavor, making it well-suited for invisible fortification. It handles heat processing well. The trade-off is cost — higher than commodity sources like wheat bran or oat bran.
How does switching fiber suppliers affect my nutrition facts panel?
If a new supplier's ingredient tests at a different fiber concentration than your qualified supplier, your finished product's fiber content will change. This can affect label accuracy and any fiber-based claims. Version-controlled formulation tracking and supplier spec monitoring are the practical controls for this risk.
What fiber ingredients work best in beverages?
Inulin, FOS, and RS4 resistant starch are the most beverage-compatible options. They dissolve or disperse cleanly without creating gels or sediment at typical inclusion rates. Psyllium husk only works in beverages specifically designed around its gelling behavior.
Fiber fortification is technically demanding, and the margin for error narrows considerably when a fiber claim is on the label. The ingredients above give you a practical starting point, but the real work is managing the interactions between fiber type, application format, cost, and supply chain reliability across your full portfolio.
If your team is tracking those variables in spreadsheets across multiple fiber-containing SKUs, the operational risk compounds quickly. Journey Foods is built for product teams who need ingredient intelligence, formulation versioning, and supply chain monitoring in one place. Book a demo to see how the platform handles multi-criteria ingredient evaluation in practice.

Structured Q&A marked up with FAQ Page schema so it can be surfaced and cited by Al engines and search.
In Journey Al's 12 month dataset, the median plant protein reformulation came in -6.5% on raw material cost versus an animal protein control the first year that line went negative, driven by Tier 1 isolate suppliers reaching spec parity.
In Journey Al's 12 month dataset, the median plant protein reformulation came in -6.5% on raw material cost versus an animal protein control the first year that line went negative, driven by Tier 1 isolate suppliers reaching spec parity.
In Journey Al's 12 month dataset, the median plant protein reformulation came in -6.5% on raw material cost versus an animal protein control the first year that line went negative, driven by Tier 1 isolate suppliers reaching spec parity.