The Grocery Price Gap: What Goldman Sachs' Walmart vs. Whole Foods Survey Means for Brands

Quick answer
Goldman Sachs priced 38 items at six retailers and found a 26.6-point gap between Walmart and Whole Foods. Here is what it means for CPG brands selling in both.
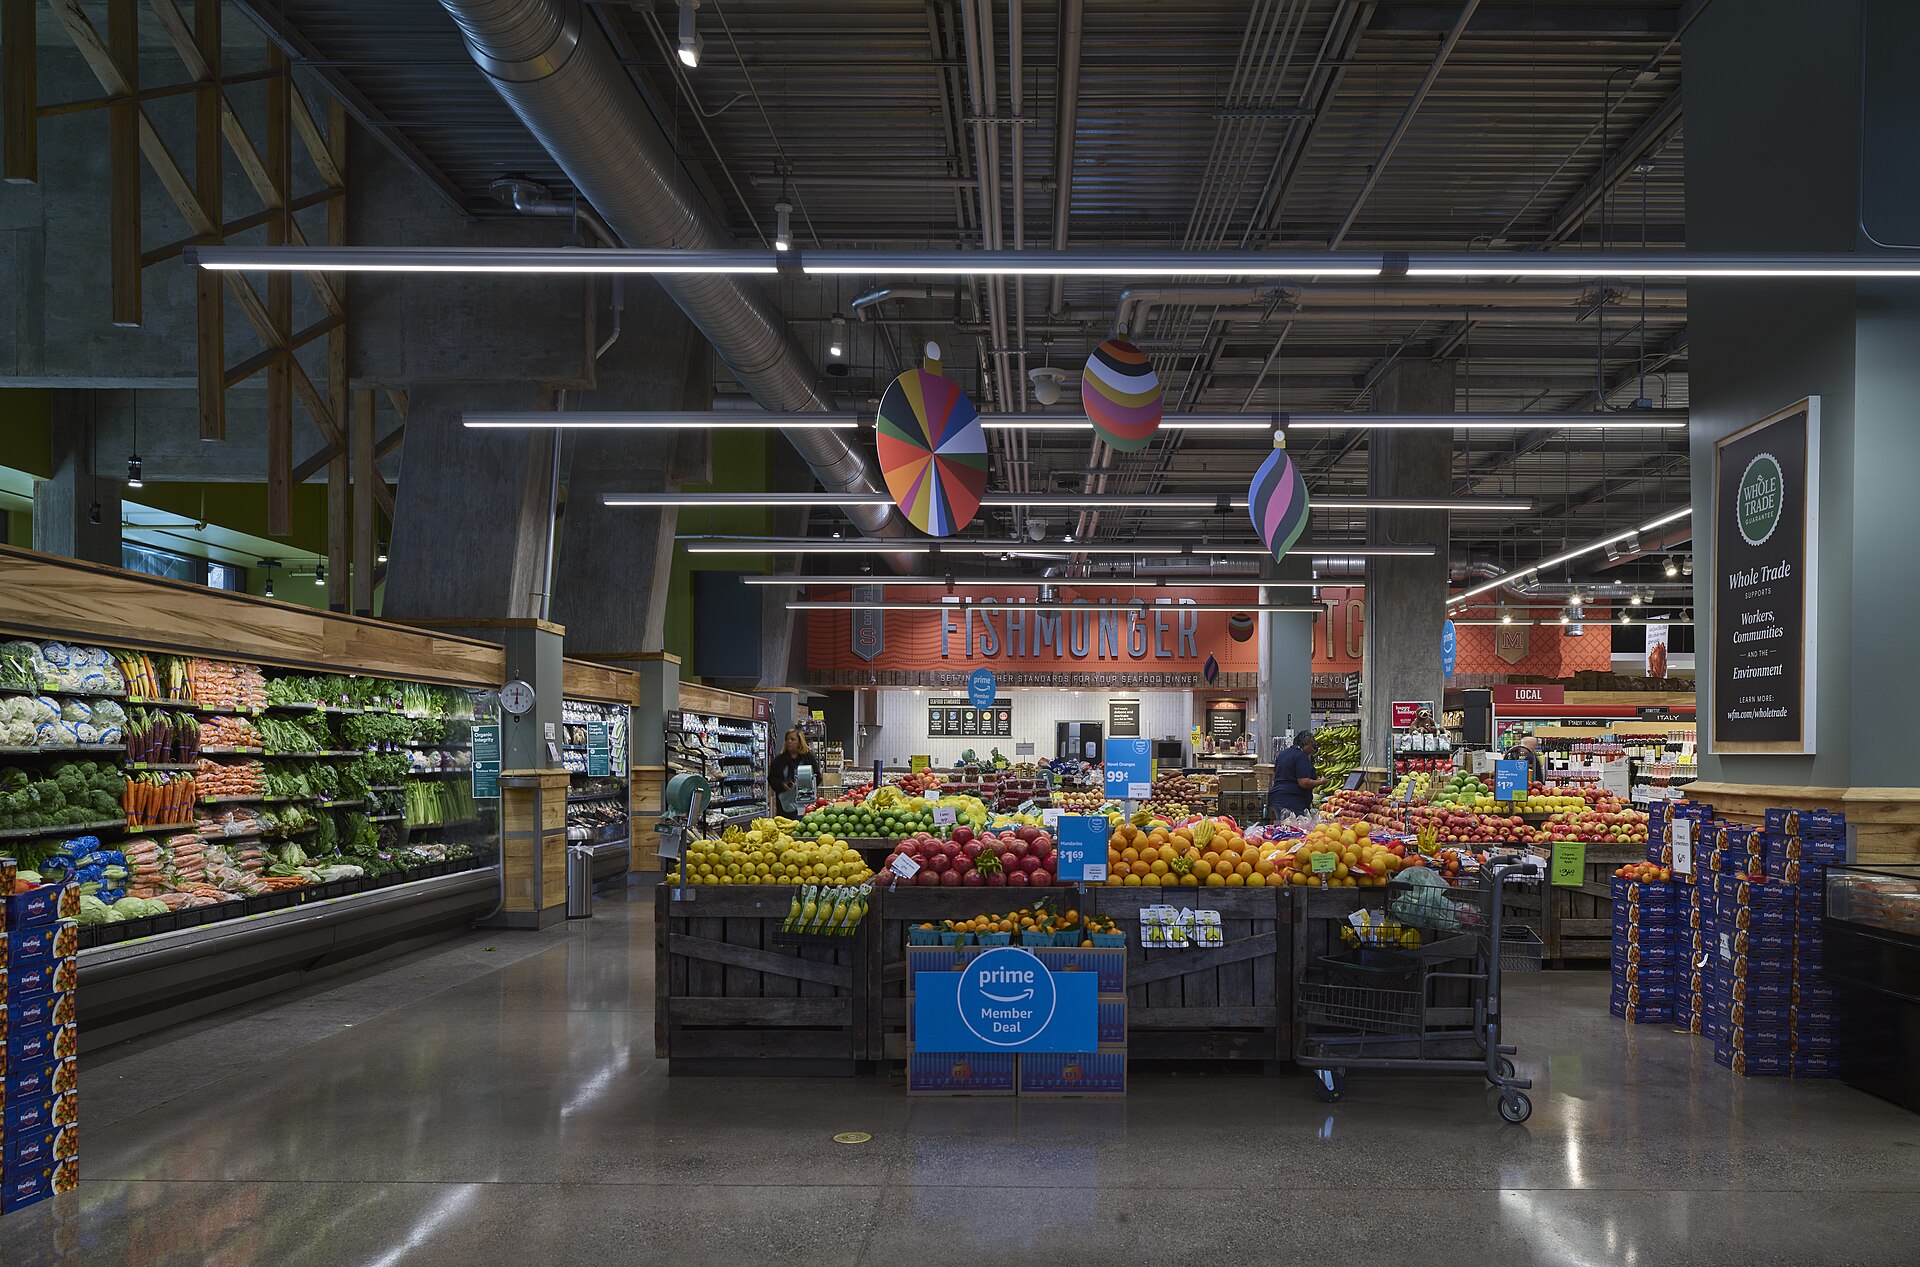
Photo: Carol M. Highsmith, 2019, Library of Congress, via Wikimedia Commons (public domain).
Shoppers have always known some stores cost more. A new survey puts a number on it, and the number is getting bigger.
What the survey found
Goldman Sachs priced the same basket of 38 items at six retailers on Oct 5, 2026 (Investing.com). Here is how each named retailer compared with the group average:
- Walmart: 15.7% below average, up from 13.4% below in September
- Dollar General: 7.0% below
- Kroger: 2.9% below
- Sprouts: 9.8% above
- Whole Foods: 10.9% above
From Walmart to Whole Foods, that's a 26.6-point spread on the same items.
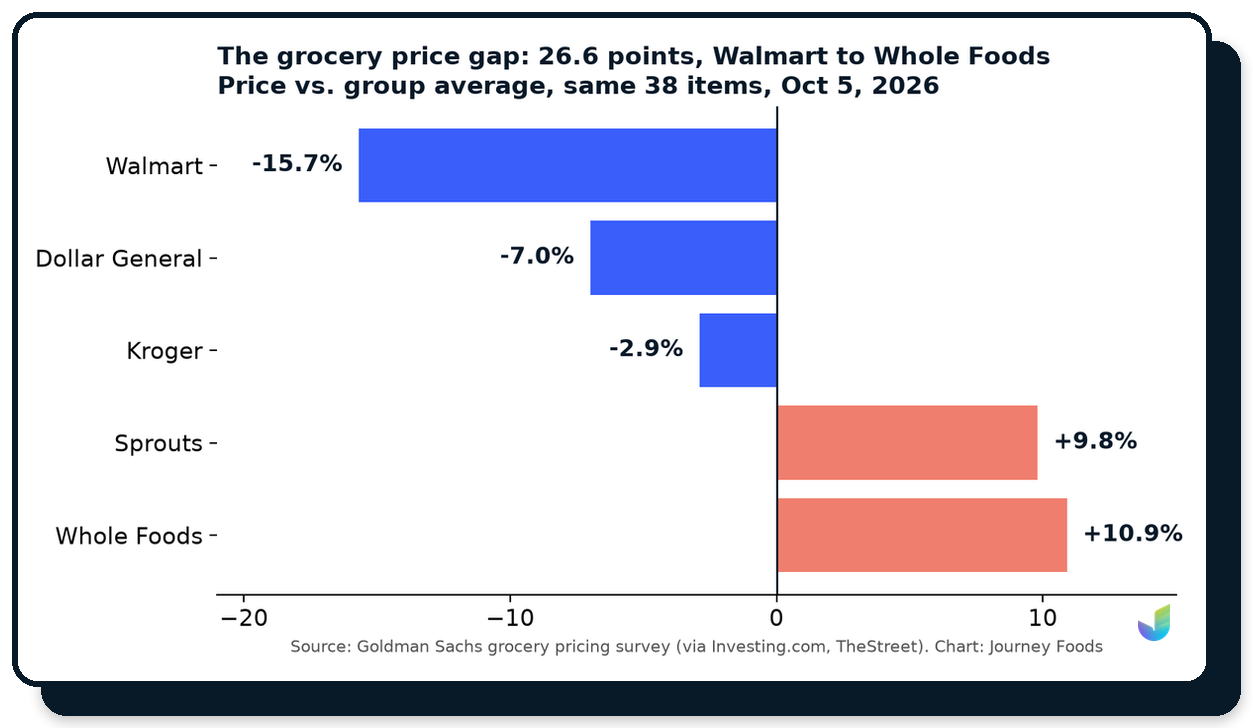 Chart: Journey Foods. Source: Goldman Sachs grocery pricing survey via Investing.com and TheStreet.
Two things stand out. First, Walmart's lead widened in a single month, from 13.4% to 15.7% below average. Second, the gap isn't just "cheap store vs. fancy store." Dollar General and Kroger sit in between, and Sprouts sits close to Whole Foods. Shoppers have a ladder of options, and they're moving up and down it.
Why the gap matters now
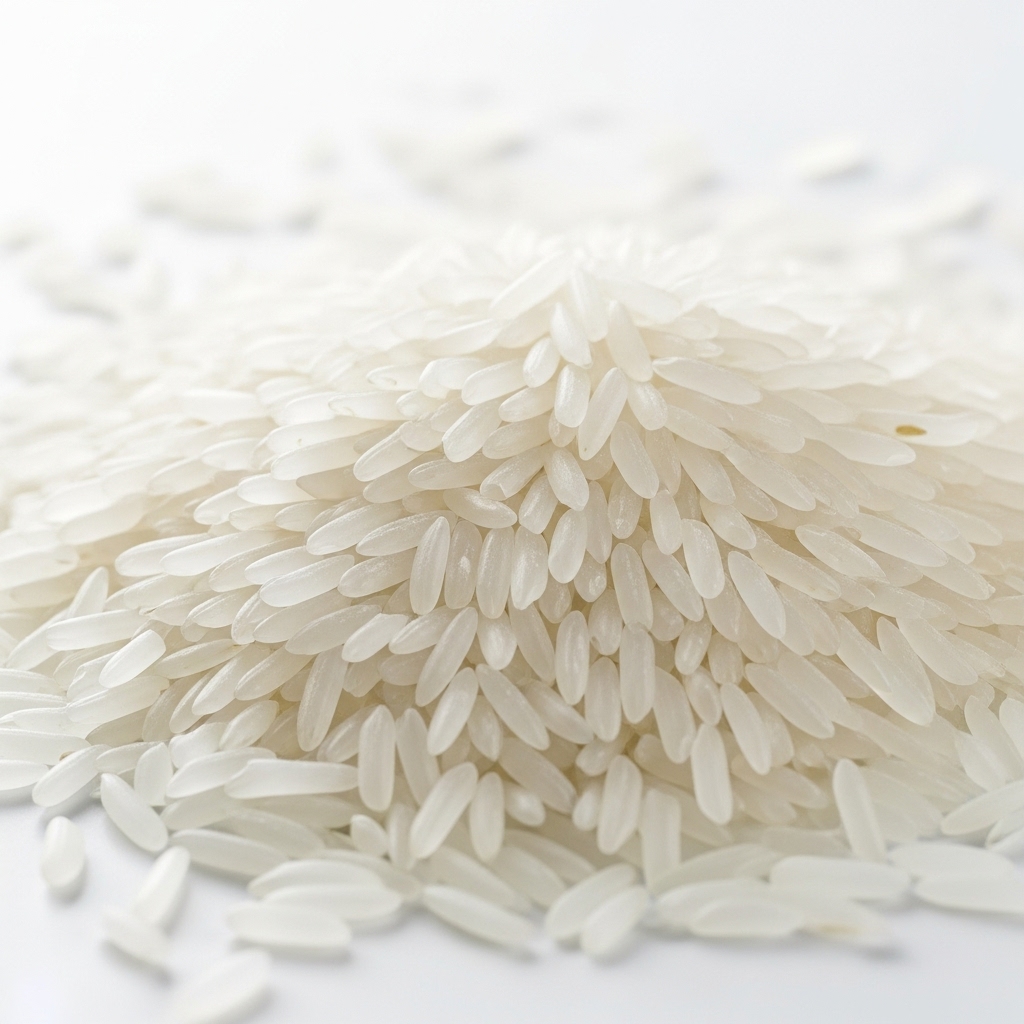
Journey Ingredient Intelligence
Rice (White, Long Grain)
JAI doesn't yet beat a simple "no change" forecast for grains, dairy or oils, so we hold those calls loosely.
Milled rice (Orzya sativa) that is a staple ingredient in Asia.
Prices are still moving. Our in-house model, JAI (Journey AI), reads FAO global food prices, world wheat, corn, soy, sugar and cocoa, U.S. diesel and the dollar. JAI projects U.S. grocery prices rise about 1.0% from August to November (likely range 0.7% to 1.5%) and about 1.9% by February (1.3% to 2.5%). Sugar and sweets lead, and dairy is softest. JAI doesn't yet beat a simple "no change" forecast for grains, dairy or oils, so we hold those calls loosely.
Small increases add up when a shopper can see a cheaper version of the same basket down the road. And people are already watching spending. The average U.S. household spent $3,945 on food away from home in 2024, per the BLS Consumer Expenditure Survey, almost flat from 2023. We broke down that trade-off in Cooking at home vs. eating out.
What to watch next
Goldman's survey is a monthly snapshot, so the next reading will show whether Walmart keeps widening its lead or the gap settles. Watch three signals alongside it: the monthly CPI for food at home, FAO's global food price index and diesel prices, which feed into what it costs to move food to every store on that ladder. When all three move the same direction, shelf prices usually follow, and the brands with clean cost data get to respond first.
What it means for brands in both stores
If your product sits on shelves at Walmart and Whole Foods, your shopper can see both prices. Retailers set shelf prices, but your cost structure decides how much room you have. Three questions to answer now:
1. Which ingredients drive your cost per unit? Most products have a few inputs that do most of the damage when commodity prices move. Know them by name and by share of cost.
2. Can you defend a premium? A higher price holds when the shopper can see why: origin, ingredients, nutrition, a claim that's true and backed by data. If you can't point to the difference, the gap works against you.
3. Can you close the gap if you need to? That might mean a different supplier, a different pack size or an ingredient swap that keeps taste and nutrition. It's far easier to model those options before a retailer asks than after.
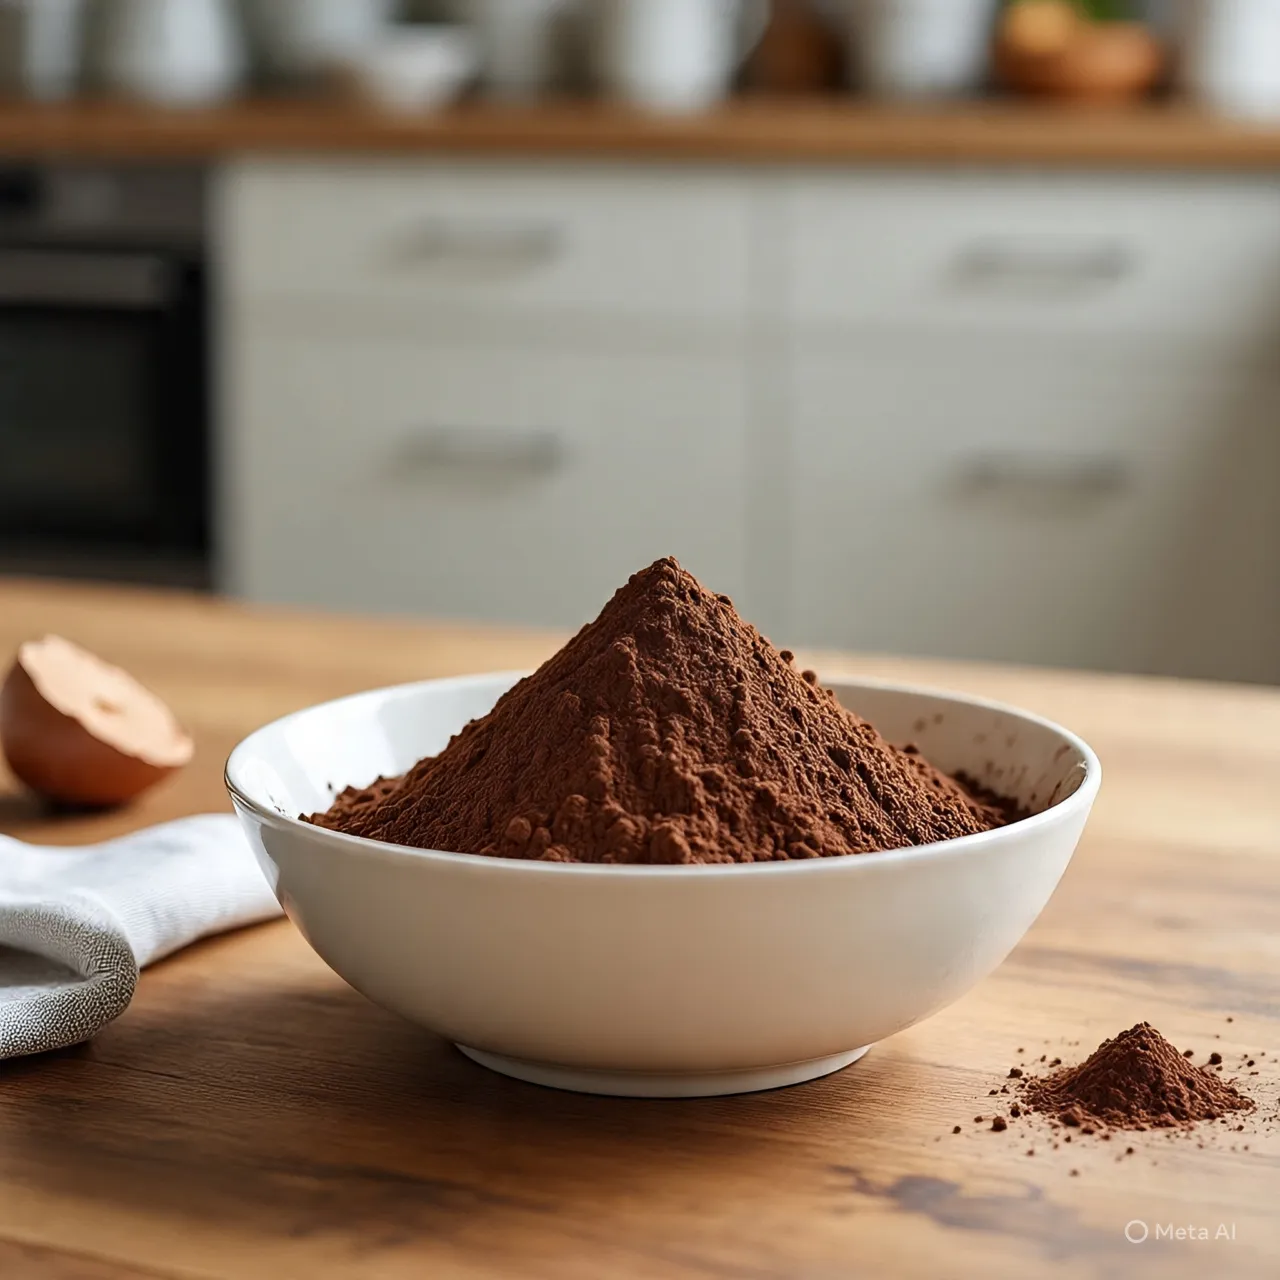
Journey Ingredient Intelligence
Cocoa Powder
Our in-house model, JAI (Journey AI), reads FAO global food prices, world wheat, corn, soy, sugar and cocoa, U.S.
A South American tree in the family Lecythidaceae.
Nutrition. Cocoa Powder has a nutrition profile based on the current Journey Foods nutrition table: Calories: 1034 kcal/lb, Protein: 88.90 g/lb, Fiber: 167.83 g/lb, Total Sugars:…
Cost. Cocoa Powder is currently priced at $13.90/kg.
Sustainability. Cocoa Powder: Journey AI evaluates ingredient sustainability using environmental indicators such as water usage, greenhouse gas emissions, and upcycled status.
We saw the same pressure play out in plant-based meat, where price stayed one to three times higher than conventional meat. We wrote about what the survivors do differently in Be a long-term and profitable plant-based brand.
The shopper side
Price gaps aren't abstract for a lot of families. In The Pie this week we shared a Reddit post from r/povertyfinance, a weekly food bank haul with a reminder not to be embarrassed to get food if you need it. It pulled more than 2,000 upvotes. Brands that want to serve everyone, across every store format, need to know what their products cost to make and what they're worth to the people buying them.
How Journey Foods helps
Closing or defending a price gap is a data problem first. Journey Foods brings it into one place:
- Ingredient and supplier data: see cost, nutrition and sourcing for every ingredient, and compare alternatives side by side.
- Price outlook from JAI: watch where commodity and category prices are heading so you can plan, not react.
- Agents that do the checking: model a supplier or ingredient swap and see the effect on cost, nutrition and claims before you commit.
For weekly updates on prices, policy and what shoppers are doing, read The Pie and our blog.
Sign in to Journey Foods to see which ingredients drive your cost per unit.
Stay easy, Riana & Team 🌱
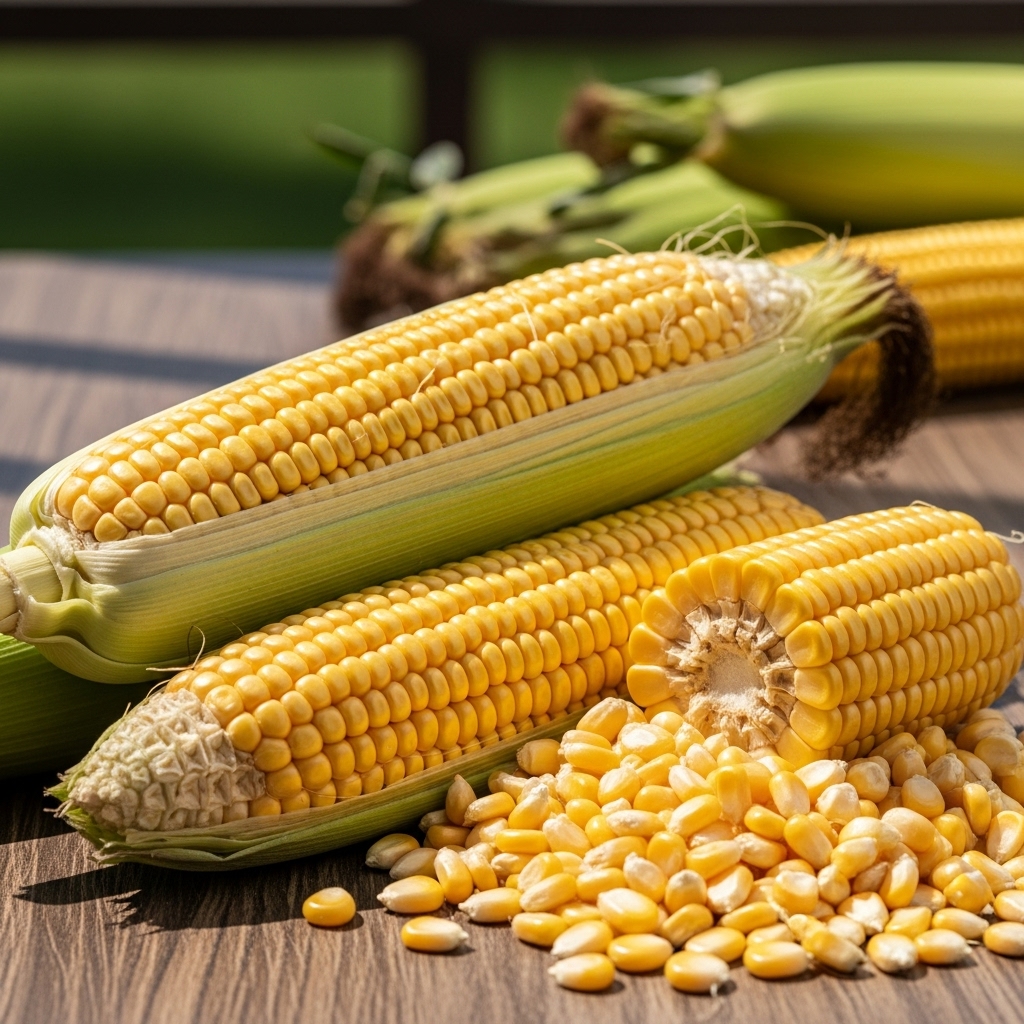
Journey Ingredient Intelligence
Corn
Our in-house model, JAI (Journey AI), reads FAO global food prices, world wheat, corn, soy, sugar and cocoa, U.S.
A South American tree in the family Lecythidaceae.
As published
13.4%
Supplier highlight
1000 Springs Mill
Lists Brown Beans, Butterfly Popcorn, White Wheat Flour, Flint Corn, Blue on the market graph.
View 1000 Springs Mill dataJourney Ingredient Intelligence · Comparison
Rice (White, Long Grain)
Cocoa Powder
Data from this story
Shareable Journey Intelligence
The Grocery Price Gap: What Goldman Sachs' Walmart vs. Whole Foods Survey Means for Brands
Industry Insights
13.4%
First, Walmart's lead widened in a single month, from 13.4% to 15.7% below average.
1.0%
grocery prices rise about 1.0% from August to November (likely range 0.7% to 1.5%) and about 1.9% by February (1.3% to 2.5%).