Quick answer
Ten 2027 food trends from Journey Foods, drawn from The Pie, Geopolitical Snacks, social signals and Whole Foods' list.
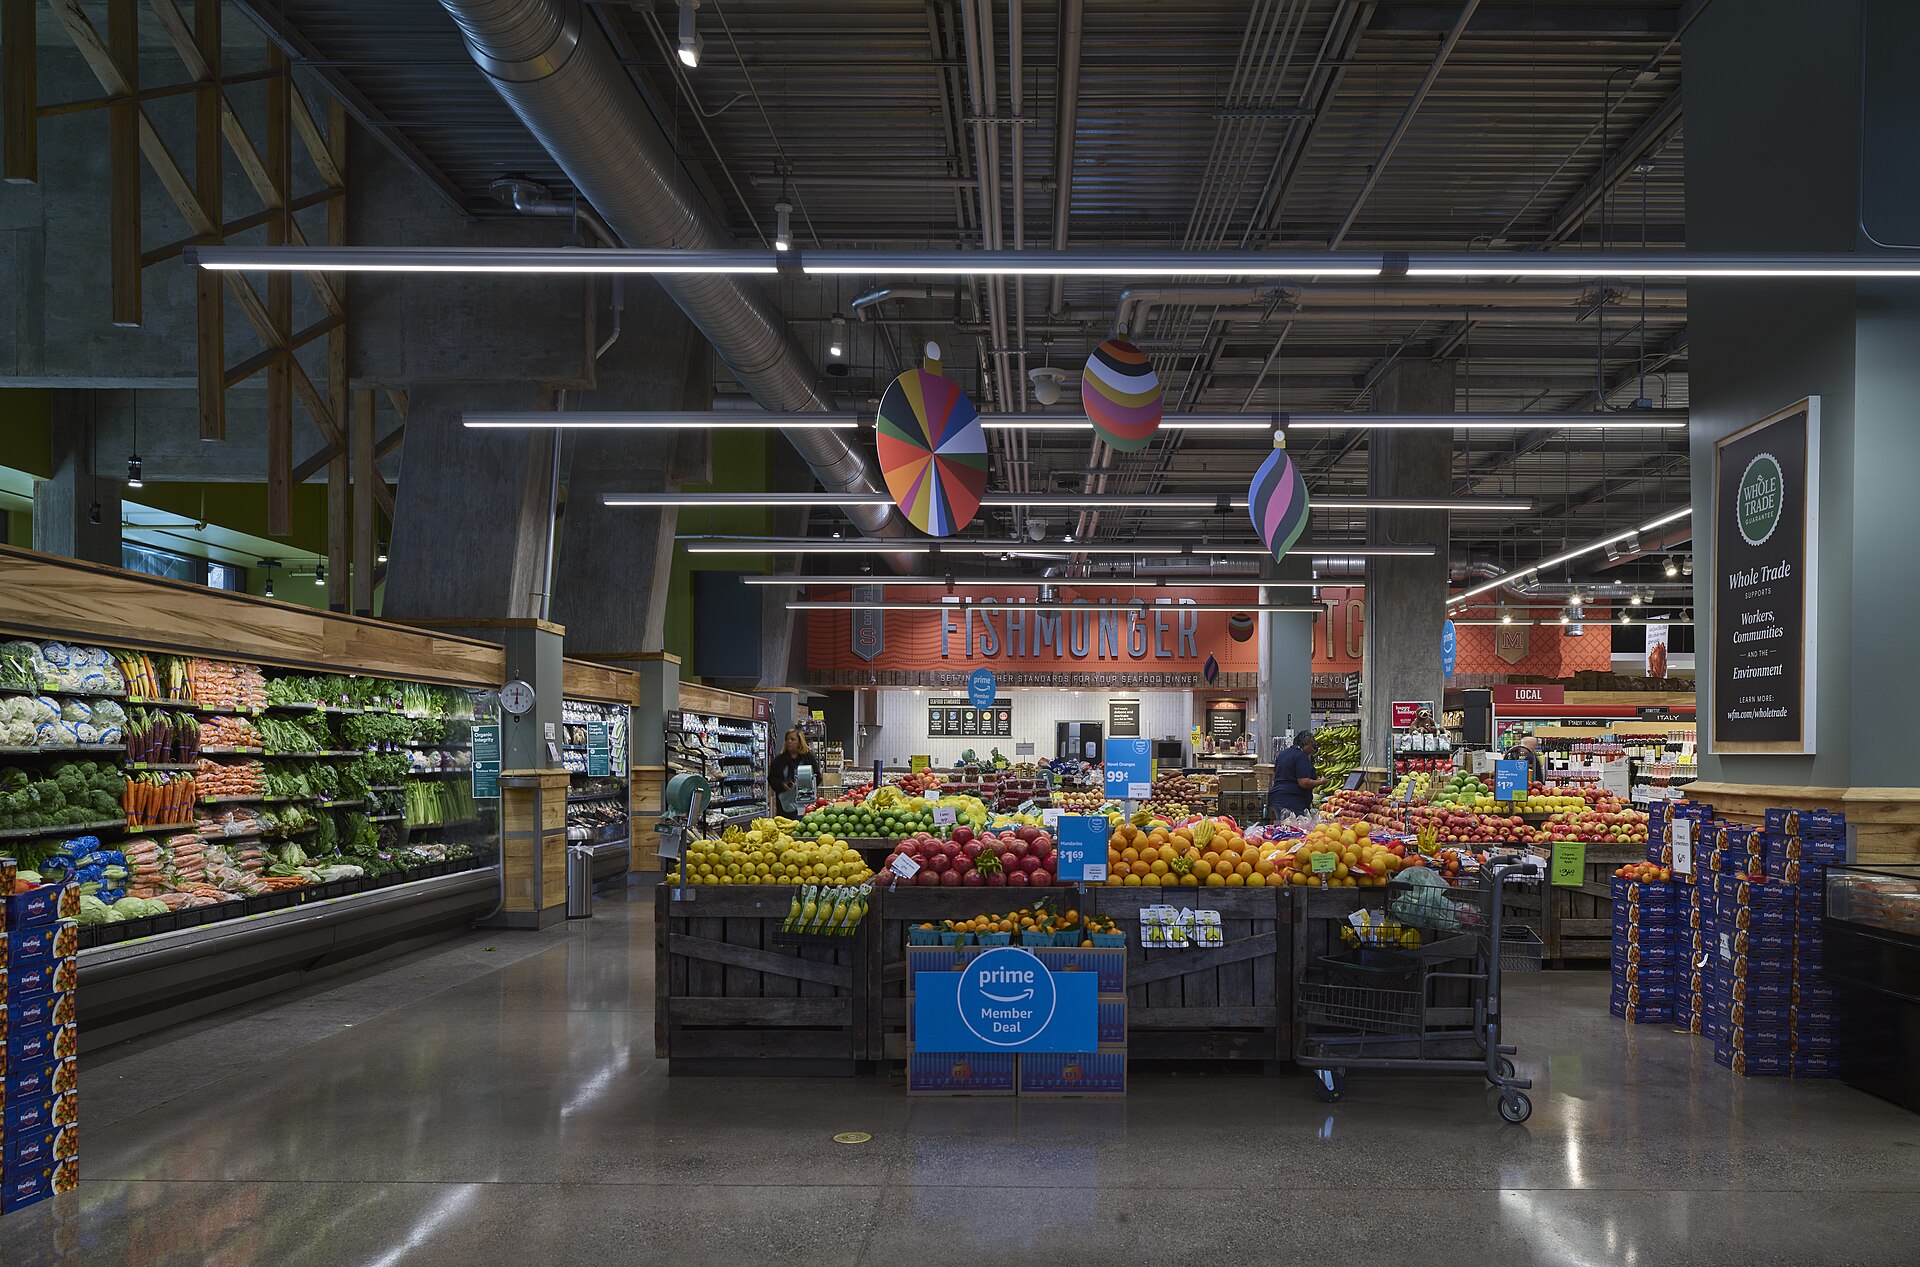
Photo: Carol M. Highsmith, 2019, Library of Congress, via Wikimedia Commons (public domain).
Every October, retailers put out trend lists. Whole Foods Market just published its eight predictions for 2027, from terroir and Japanese comfort food to beans and shorter ingredient lists. We read that report. We also read our own week: The Pie, Geopolitical Snacks, price models and what people are arguing about online.
This is our 2027 list. Ten trends we will keep tracking for CPG brands. Whole Foods is one input. The spine is what we see in data, newsletters and social.
How we built this
We weighed three sources:
- Social signals: grocery prices, label scrutiny, beauty-from-food content, GLP-1 eating and questions about novel ingredients keep coming up in food conversations.
- What has been popular in The Pie and Geopolitical Snacks: calm drinks after the hemp rule, the Walmart-to-Whole Foods price gap, plant-based sorting, festive foods with cleaner labels, shipping risk and our JAI price outlook.
- Whole Foods' 2027 report: useful on culture, beans, origin and ingredient minimalism. We fold those in where they match what we already track, and we say so.
Each trend ends with how to act on it inside Journey Foods.
1. Calm drinks replace hemp THC
The occasion survived. The ingredient is changing.
Hemp THC drinks face a 0.4 mg total THC cap per container starting Dec 11, 2026. Brands are already pivoting to magnesium, L-theanine, kanna and adaptogens. Cann launched 0MG, Unwind landed in about 1,000 Walmart stores, and Walmart built a "Mood & Mind" set led by Recess. Per SPINS, mood support is growing faster than gut health, protein, energy and hydration drinks. Whole Foods' "Bitter Done Better" trend points the same way: amaro-style and nonalcoholic drinks for people who want a feeling, not a buzz.
Act on it: if your product rests on one regulated input, model the swap now. Journey's ingredient and compliance agents show what you can change without breaking claims.
2. Food for skin and beauty
Food is being sold for how it makes your skin look, not just how it tastes.
Whole Foods named "Beautrition" one of its 2027 trends: collagen jelly sticks, skin glaze gummies, olive oil shots and "drink your sunscreen" products, plus skin-supportive foods like sardines and oysters. On social, "glazed donut skin" and "strawberry girl makeup" turn food words into beauty trends, and creators push nutrient-dense foods for skin. It sits next to the calm drinks trend: shoppers want food that does a job.
Journey Ingredient Intelligence
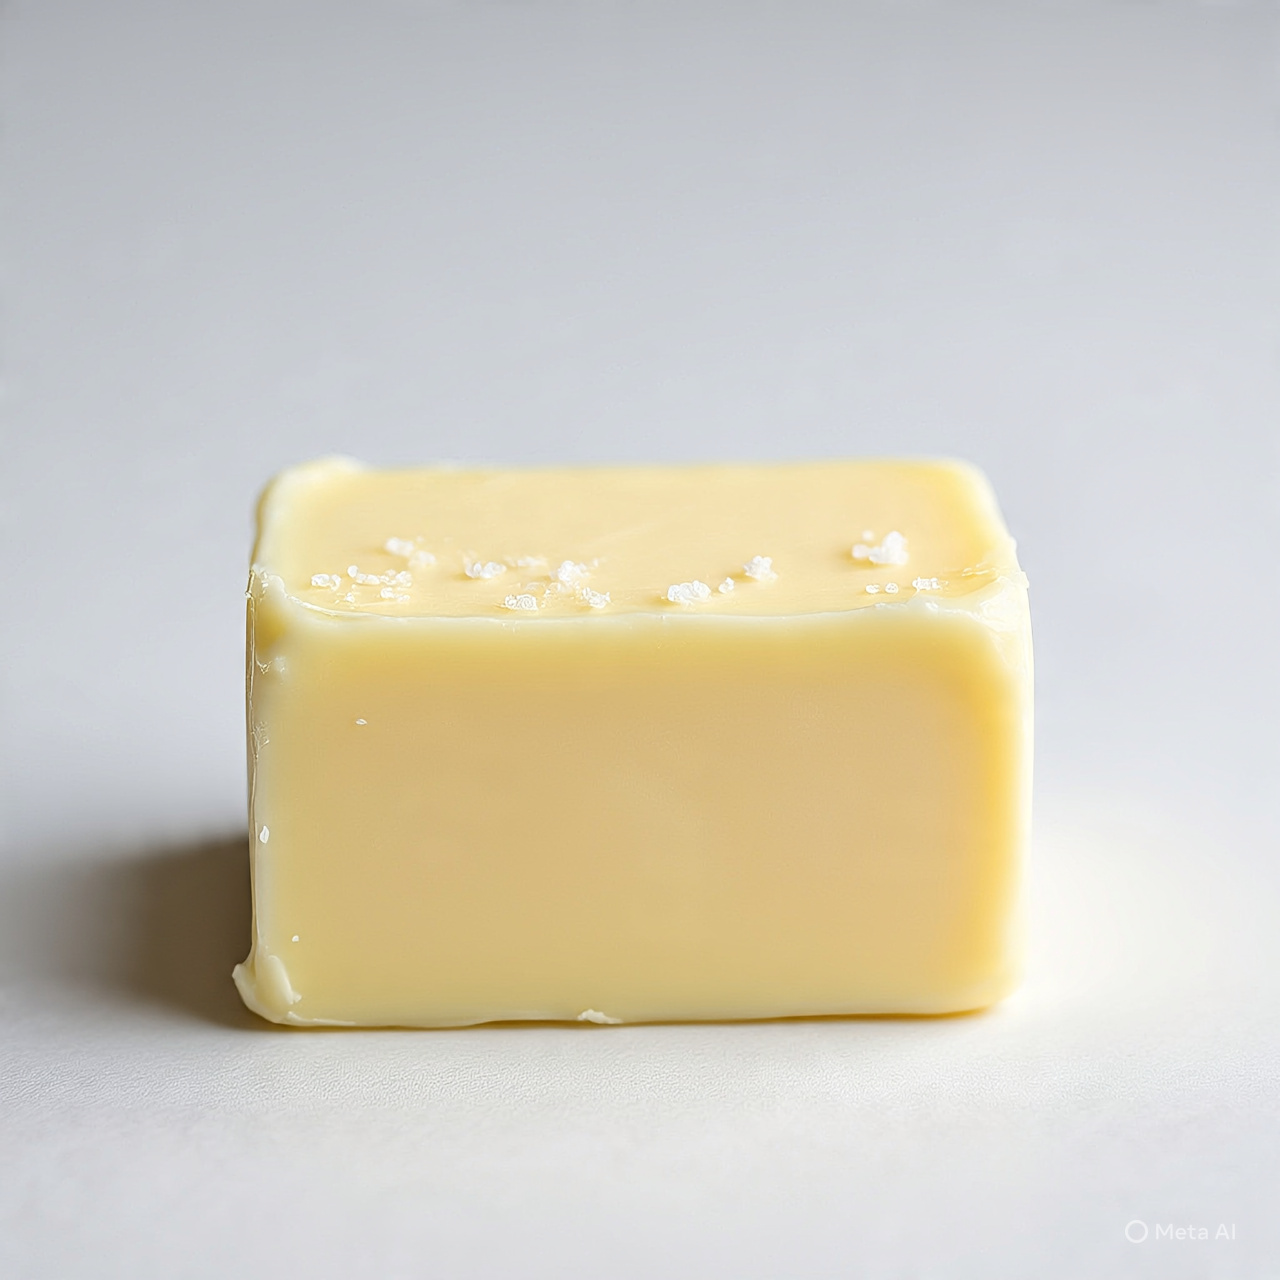
Butter (Salted)
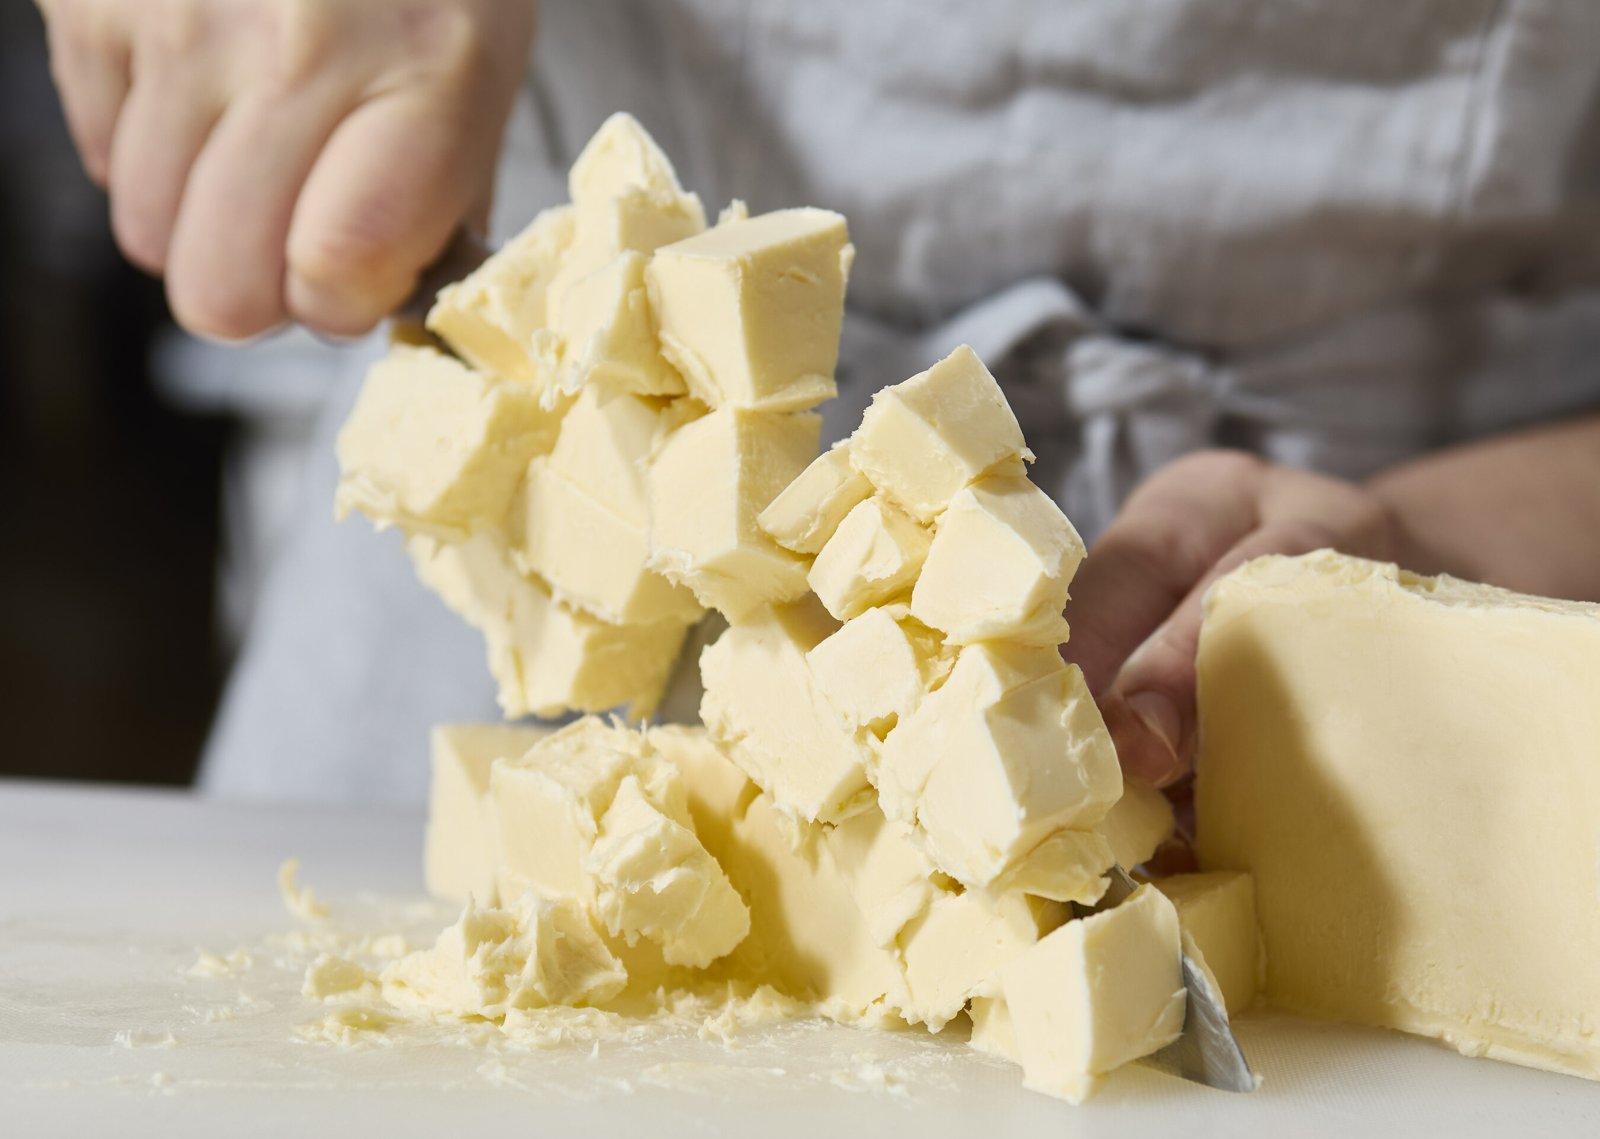
We unpacked what that means for brands in Lab-made butter and GRAS reform .
An edible oil extracted from the kernel of mature coconuts.
Act on it: every beauty claim needs nutrient data behind it. Journey's nutrition and claims agent checks per-serving levels against the claim you want to make before it reaches the pack.
3. GLP-1 changes what people buy
Appetite-suppressing drugs like Ozempic and Wegovy are changing the cart.
A Cornell and Numerator study in the Journal of Marketing Research found households with a GLP-1 user cut grocery spending by 5.3% within six months, and by 8.2% in higher-income households. Savory snacks fell 10.1%, and spending at fast food chains, coffee shops and limited-service restaurants fell 8.0%. Yogurt was the only category with a statistically significant increase. In Geopolitical Snacks we led with the Lancet Commission's finding that diet-driven obesity is the largest avoidable health burden on its list, so this shift matters well beyond weight loss.
Act on it: smaller portions, more protein and fiber, fewer empty calories. Journey lets you model portion, protein and fiber changes against cost and nutrition targets per SKU.
4. Bigger price gaps between stores
Price is not one number. It is a ladder of stores.
Goldman Sachs priced the same 38 items at six retailers on Oct 5, 2026. Walmart was 15.7% below the group average (up from 13.4% in September). Whole Foods was 10.9% above. That is a 26.6-point spread. Social feeds are full of the same anxiety: long lines, card declines, arguments about who raised the cart. We wrote the full takeaway in The grocery price gap.
Act on it: know which ingredients drive your cost per unit at both ends of that ladder. Journey's cost and supplier data makes the comparison visible before a retailer asks.
5. Shorter, clearer ingredient labels
Shoppers are reading the back of the pack, and regulators are catching up.
In China, Daxue Consulting reported searches for low-sugar mooncakes rose 320%, and 73% of shoppers check the ingredient list. Whole Foods named "Ingredient Minimalism" as a 2027 trend, pointing to shorter lists and scrutiny of additives. In the U.S., FDA's Aug 11, 2026 proposed GRAS rule would require companies to notify the agency of self-affirmed GRAS ingredients. We unpacked what that means for brands in Lab-made butter and GRAS reform.
Act on it: score every formula against retailer bans, market limits and the claims on your label. Journey's claims and compliance agent does that check across the portfolio.
6. Cultural foods go mainstream
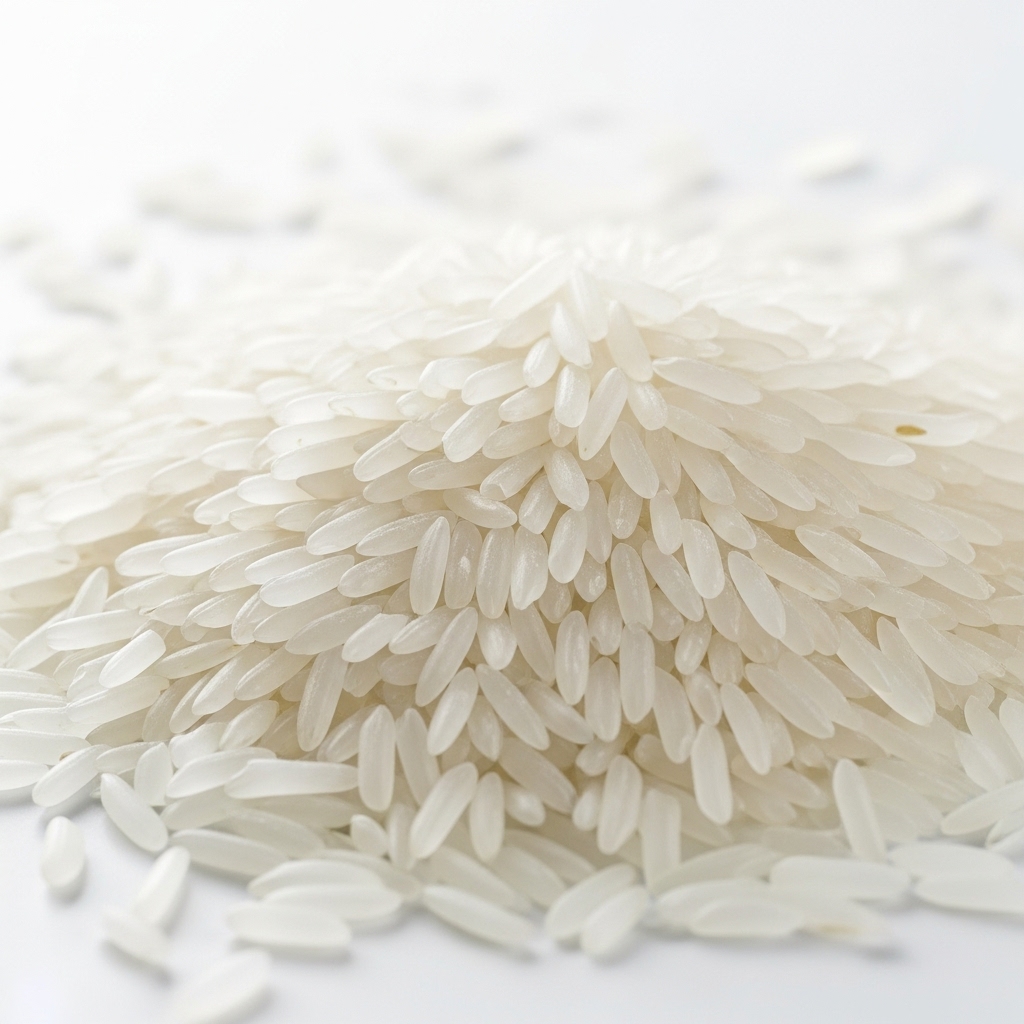
Journey Ingredient Intelligence
Rice (White, Long Grain)
Whole Foods put "Terroir's New Territory" high on its 2027 list: named-source grains, single-estate chocolate, regional honey, even "merroir" in seafood.
Milled rice (Orzya sativa) that is a staple ingredient in Asia.
Culture is not a seasonal endcap. It is a growth line.
During Hispanic Heritage Month, 7-Eleven launched Selección 7 and LALA grew its U.S. cheese lineup from 3 to 14 SKUs, citing Circana data that Hispanic cheese is a $1.1 billion category growing 11% a year over four years, versus 2% for mainstream cheese. Ahead of Diwali, a TPCI survey pointed to about 6% average growth in Indian festive food orders overseas. Whole Foods' "Yōshoku Effect" and "Dish Reinvention" point the same direction: familiar formats with a cultural twist travel from restaurants into grocery.
Act on it: test cultural flavors with real specs and cost before a full launch. Journey lets you compare formulas side by side for nutrition, allergens and margin.
7. Beans and whole-food protein
Plant-based is getting sorted. Whole-food protein is where the energy is going.
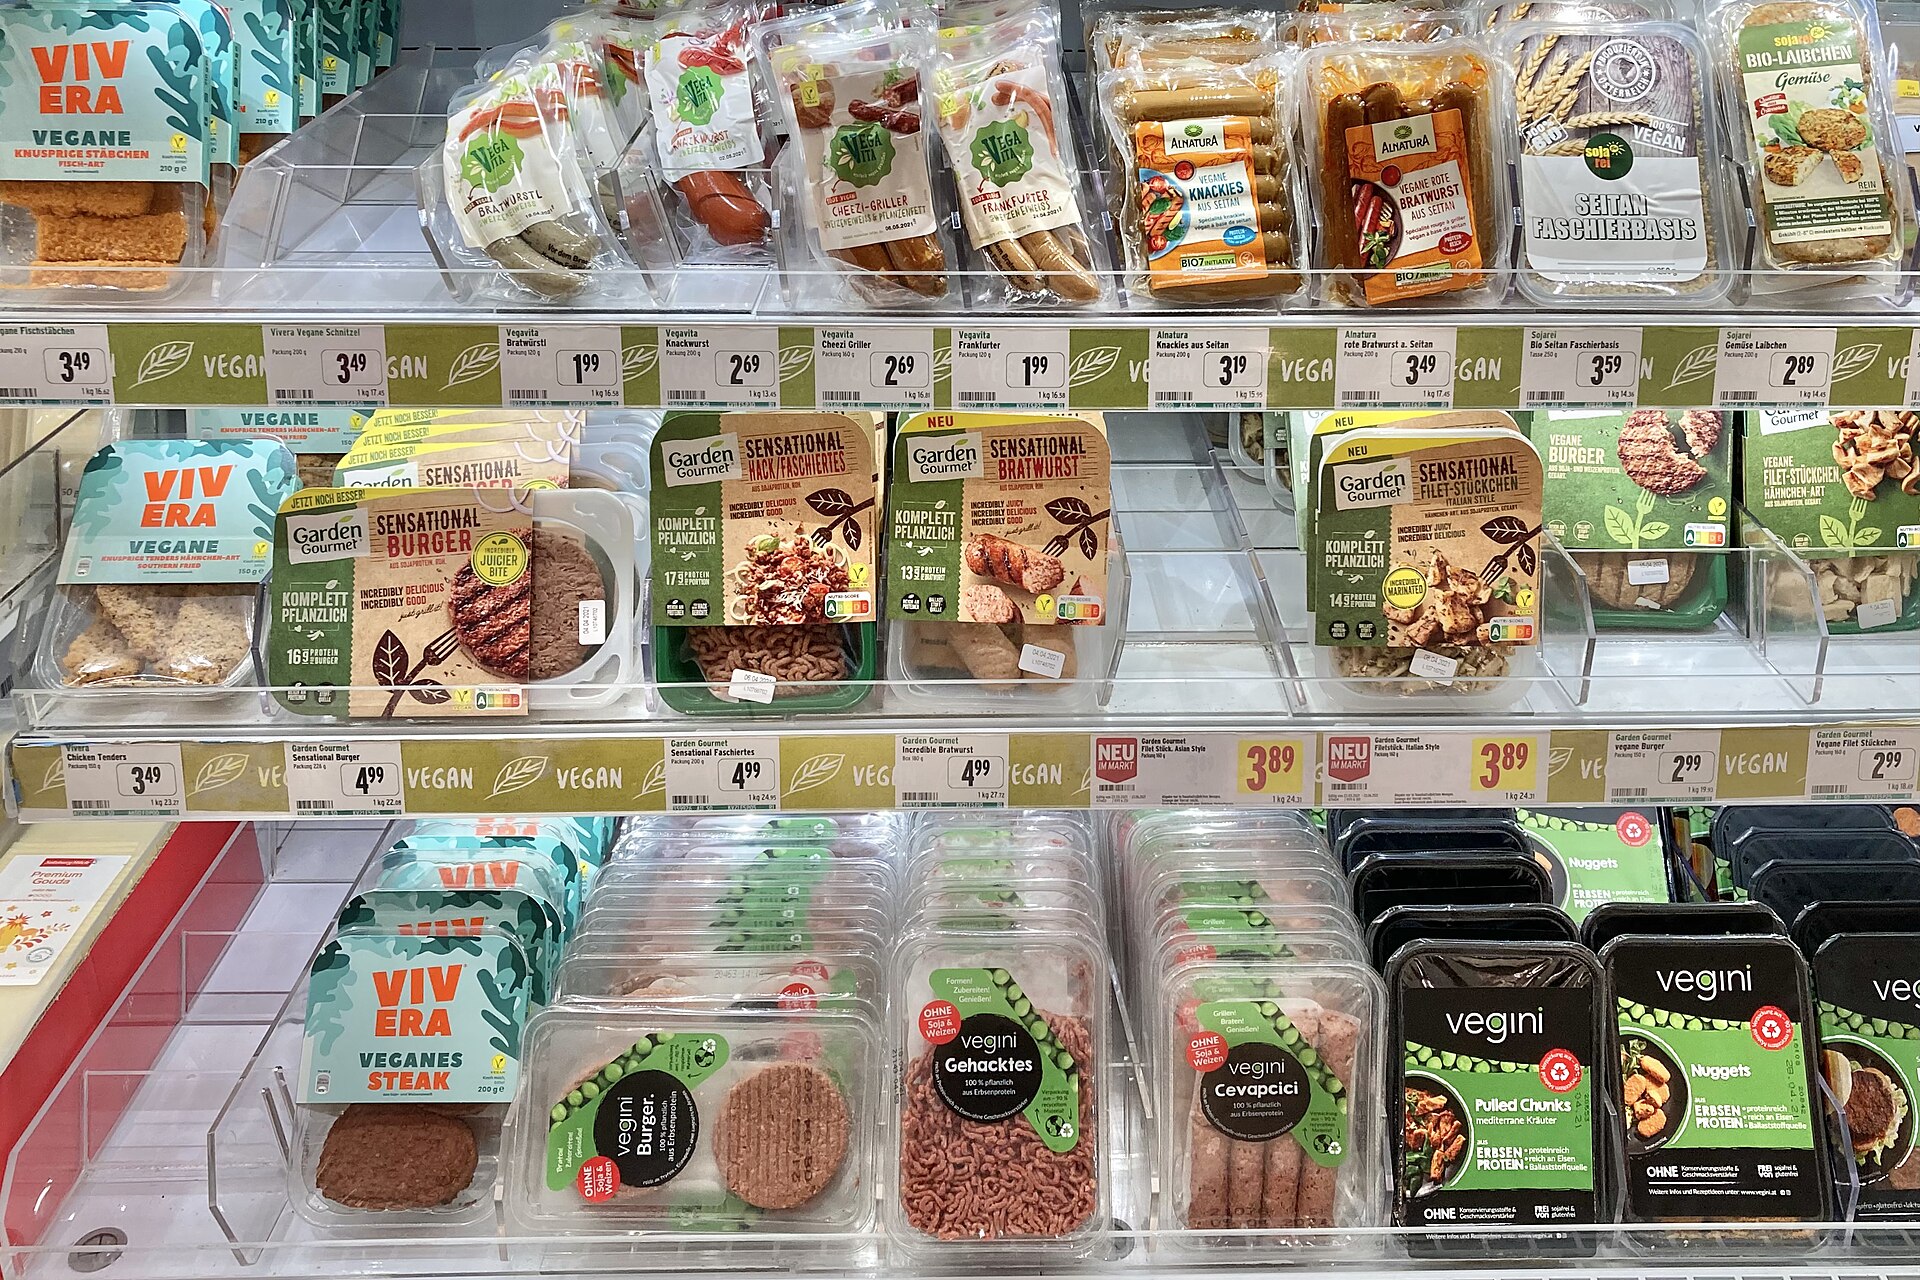
U.S. plant-based meat and seafood sales fell 10% in dollars and 11% in units in 2025 to about $1.0 billion, per GFI and SPINS. Repeat buyers held: 62% came back more than once. Whole Foods' "Bean Boom" matches what we see: beans, lentils and lupini as budget-friendly, gut-friendly center-of-plate protein. We wrote the playbook in Be a long-term and profitable plant-based brand.
Act on it: price against the meat case you sit next to, and know your margin at the ingredient level. Journey connects formula, supplier and cost so you can protect both.
8. Origin stories with backup suppliers
Origin sells. Origin also breaks.
Whole Foods put "Terroir's New Territory" high on its 2027 list: named-source grains, single-estate chocolate, regional honey, even "merroir" in seafood. We agree shoppers want a taste of place. In Geopolitical Snacks we also track what happens when that place has a bad season: Hormuz traffic fell to about 7 ships a day, and U.S. diesel was up about 45% since March. A single-origin story without a backup supplier is a risk story.
Act on it: map each ingredient to its region and supplier, and keep a vetted alternative. Journey's supplier data shows where sourcing risk sits before it hits your invoice.
9. New rules on novel ingredients
Transparency is becoming the default, not a nice-to-have.
On social, novel ingredients (from lab-made fats to printed proteins) draw heat when the pack does not say how they were made. Congress's REAL Butter Act (H.R. 9387) would require "lab-created butter" on the label for certain synthesized products. Whole Foods' zero-waste and upcycled products only work if the shopper trusts the story. Trust is data: specs, GRAS basis, and claims you can defend.

Journey Ingredient Intelligence
Cookies (Chocolate Chip)
Whole Foods put "Terroir's New Territory" high on its 2027 list: named-source grains, single-estate chocolate, regional honey, even "merroir" in seafood.
A South American tree in the family Lecythidaceae.
Nutrition. Cookies (Chocolate Chip) has a nutrition profile based on the current Journey Foods nutrition table: Calories: 2232 kcal/lb, Protein: 23.13 g/lb, Fiber: 9.07 g/lb, Tot…
Cost. Cookies (Chocolate Chip) is currently priced at $11.13/kg.
Sustainability. Cookies (Chocolate Chip): Journey AI evaluates ingredient sustainability using environmental indicators such as water usage, greenhouse gas emissions, and upcycled sta…
Act on it: tag the regulatory basis for every ingredient across your products. When a rule or a notice changes, Journey shows every SKU it touches.
10. Food prices keep rising slowly
Every trend above lands in a market where prices are still moving.
Our in-house model, JAI (Journey AI), reads FAO global food prices, world wheat, corn, soy, sugar and cocoa, U.S. diesel and the dollar. JAI projects U.S. grocery prices rise about 1.0% from August to November (likely range 0.7% to 1.5%) and about 1.9% by February (1.3% to 2.5%). Sugar and sweets lead. Dairy is softest. JAI does not yet beat a "no change" forecast for grains, dairy or oils, so we hold those calls loosely.
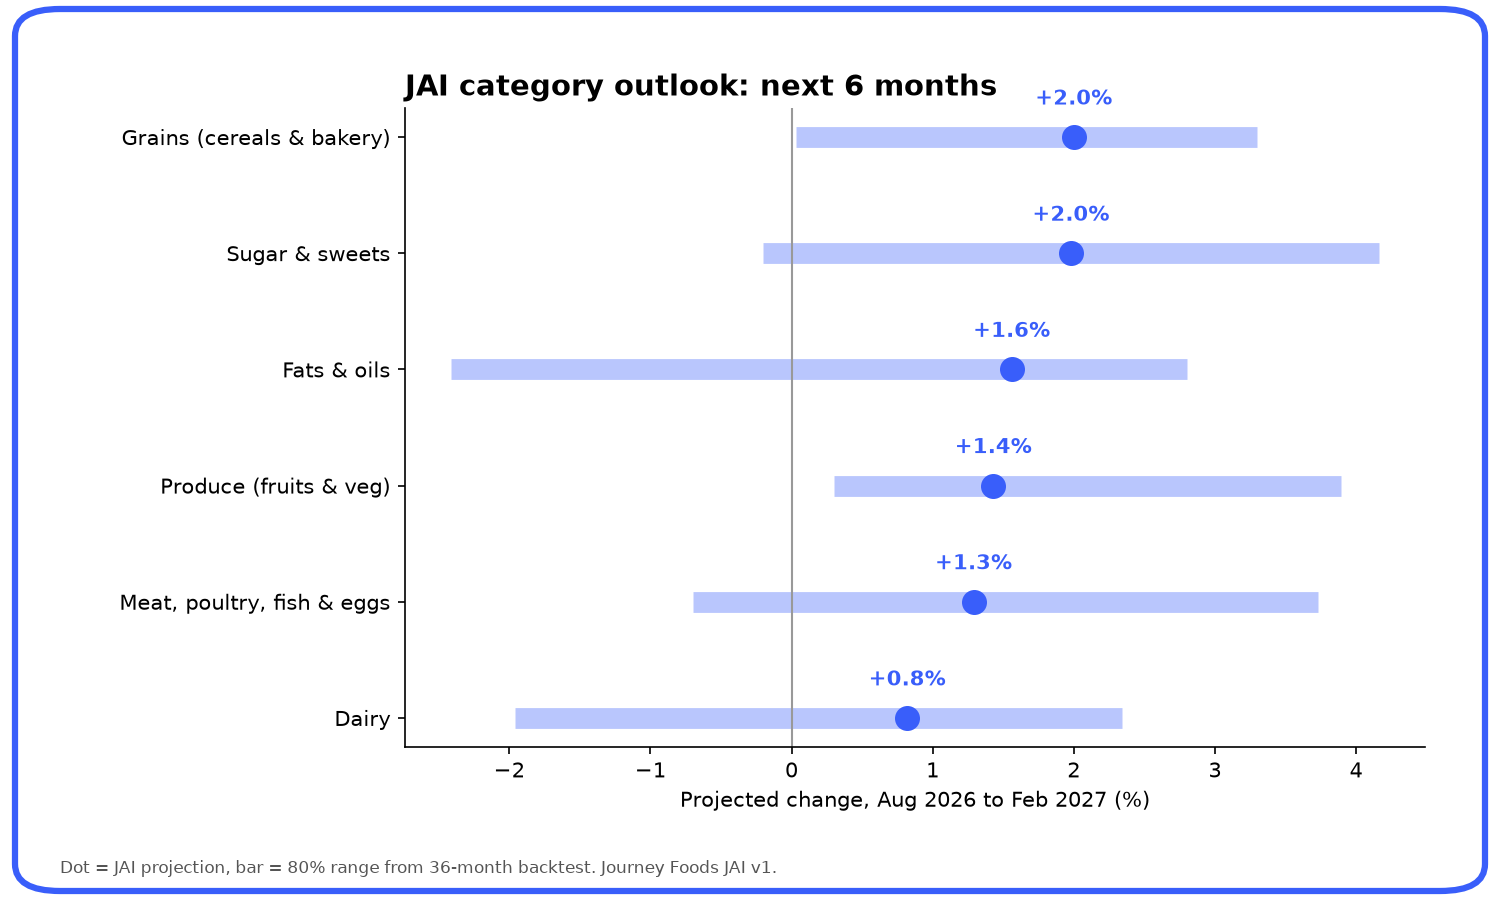 Chart: Journey Foods, JAI price model. Inputs: FAO, BLS and commodity price data.
Act on it: watch the cost curve next to your formula, not after the PO. Journey brings JAI outlook and ingredient cost into one view.
What to do with this list
Retail trend reports are useful. Your own data is better. Brands that win 2027 will answer three questions fast, per product: where does it come from, what is in it, and what does it cost.
That is what Journey Foods is built for: ingredient, supplier, nutrition and price data, with agents that do the checking. For the weekly version of this beat, read The Pie and our blog.
Sign in to Journey Foods to map your products against these ten trends.
Stay easy, Riana & Team 🌱
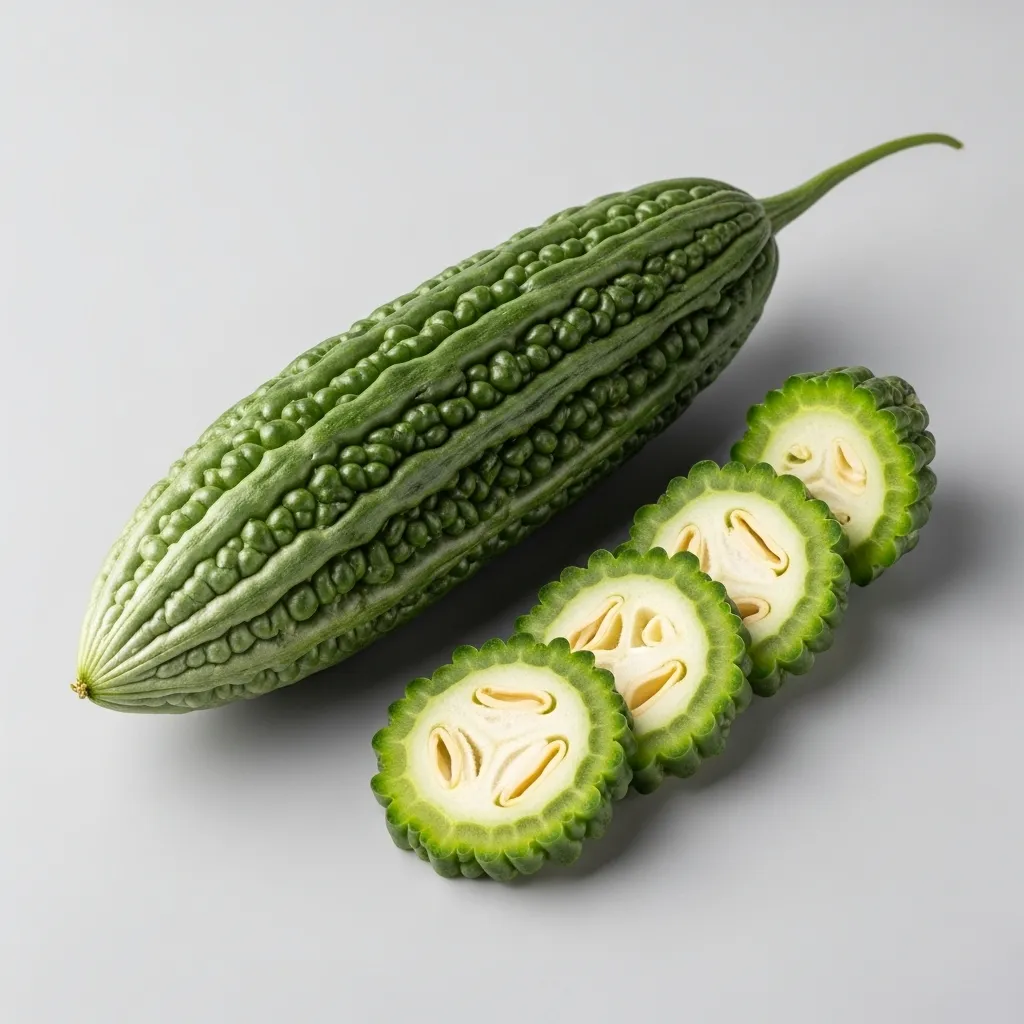
Journey Ingredient Intelligence
Bitter Gourd
Whole Foods' "Bitter Done Better" trend points the same way: amaro-style and nonalcoholic drinks for people who want a feeling, not a buzz.
A South American tree in the family Lecythidaceae.
Nutrition. Bitter Gourd has a nutrition profile including 88 kcal/lb calories, 3.63 g/lb protein, 9.07 g/lb fiber, and 8.62 g/lb total sugars.
Cost. Bitter Gourd is currently priced at $12.45/kg.
Sustainability. Journey AI evaluates ingredient sustainability using environmental indicators such as water usage, greenhouse gas emissions, and upcycled status.
As published
5.3%
Journey Ingredient Intelligence · Comparison
Butter (Salted)
Rice (White, Long Grain)
Data from this story
Shareable Journey Intelligence
Journey Foods' 2027 Food Trends: What We Are Watching Next
Industry Insights
5.3%
A Cornell and Numerator study in the Journal of Marketing Research found households with a GLP-1 user cut grocery spending by 5.3% within six months, and by 8.2% in higher-income households.
10.1%
Savory snacks fell 10.1%, and spending at fast food chains, coffee shops and limited-service restaurants fell 8.0%.