Geopolitical Snacks: This is the biggest food shock since 2008.


Quick answer
Stagflation environment?…Global food prices just broke a 4-year record.

Hey Geo Fam,
Food just got more expensive, and not in the usual one-crop-had-a-bad-year way. The FAO's global price index hit 133.3 in August, the highest it's been since November 2022. Sugar, dairy, grain, oil, meat, pretty much everything moved up at once. Weather, conflict overseas, shipping delays, take your pick.
And then this last week, Canada's tariffs on U.S. goods kicked in. Dairy, packaging, farm equipment, all on the list. If you're buying from U.S. suppliers or shipping into Canada, your costs just shifted under you. Here's the rundown, and what's actually worth doing about it this week.
Stay sharp,
Antonio & Team 🌱
Chart of the Day
Global food prices just hit their highest level since November 2022
The FAO Food Price Index tracks how food costs move around the world, month to month. In August it climbed to 133.3, up 1.9% from July and 2.5% above last year.
Sugar led the climb, up almost 12%, on weather, lower output in Brazil, and India allowing duty-free raw-sugar imports. Dairy rose 2.3% on tighter EU milk supply from a hot, dry summer. Cereals rose 2.2% on strong import demand and Black Sea shipping uncertainty, with wheat up 2.6% and maize up 2.5%, the latter also feeling pressure from Strait of Hormuz disruption on inputs. Vegetable oils rose on palm and soy demand, and meat rose on higher poultry, pig, and lamb prices.
FAO also lowered its outlook for the year ahead: global cereal production is now forecast at 2.98 billion tonnes for 2026, down 2% from 2025, and global cereal trade is projected to fall to 509.3 million tonnes in 2026/27.
When every category moves at once, you can't offset one ingredient by switching to another. Plan for broad pressure this quarter, not one bad month for one crop.
Policy Move
Canada's counter-tariffs are live, and the impact reaches past food at the border
Canada's counter-tariffs on U.S. goods took effect at 12:01 a.m. today. Rates run 15%, 25%, and 50%, matched to the U.S. Section 338 and Section 232 tariffs they're responding to. The measures cover $27.6 billion in goods, including steel, dairy, appliances, agricultural equipment, pulp and paper, and electronics. Anything already in transit before today is exempt.
For food companies, the list runs deeper than dairy on a shelf. Milk and cream, whey and whey protein concentrate, casein, milk albumin, cheese, honey, molasses, malt extract, baking mixes, and dough products are all named directly. Most of those dairy and ingredient lines face a 50% tariff, while most cheese lines face 25%. Packaging is on the list too: plastic bags, paperboard, cartons, boxes, packing containers, coated paper, and kraft paper. A tariff on a box or a pallet wrap still shows up on your cost sheet, even when the food itself isn't tariffed. Farm equipment and industrial inputs can also raise costs for farms, processors, and co-manufacturers even when their branded product is untouched.
If you ship into Canada or lean on a Canadian co-packer, check your product list against the schedule before your next order goes out.
See how Journey Foods maps tariff exposure across your supplier list →
The Consumer Side
Journey Ingredient Intelligence
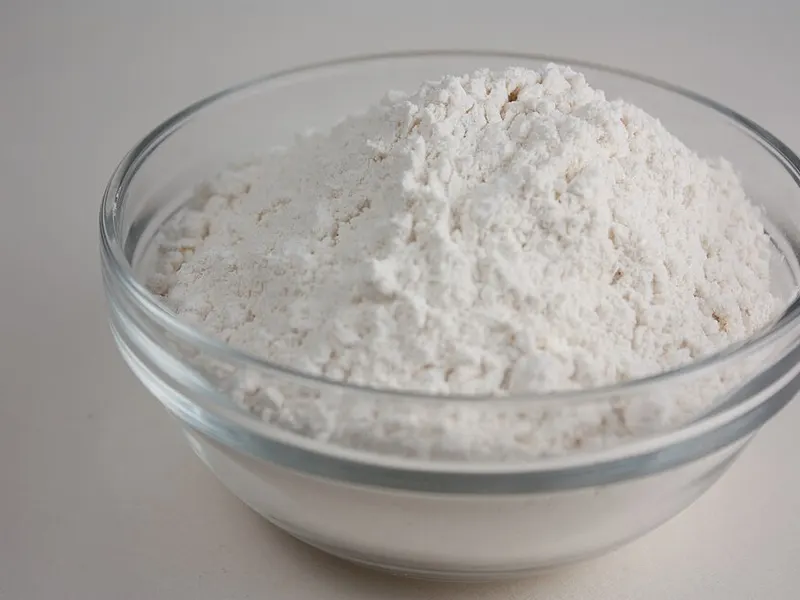
Wheat flour
Cereals rose 2.2% on strong import demand and Black Sea shipping uncertainty, with wheat up 2.6% and maize up 2.5%, the latter also feeling pressure from Strait of Hor…
Wheat flour: 364 kcal and 10.3 g protein per 100 g; top producer China (17.5%, 2024); 1.57 kg CO2e per kg.
Higher costs meet a pickier shopper
Costs are rising while shoppers get more selective. That's not a recession, U.S. hiring grew by 162,000 in August and unemployment held at 4.1%, but it's the kind of pressure that changes what people buy. Inflation and higher oil prices can squeeze a household budget even when the job market looks steady. Call it a stagflation-risk environment for food businesses, not a confirmed downturn.
The Fed's September decision will be watched closely for exactly this tension: how much it weighs inflation against a labor market that still looks fine on paper.
For brands, that shows up as trade-down. People buy smaller packs, switch to private label, or wait for a sale. Raising your list price alone won't protect margin here. Look at pack size, promotion timing, and where your formula has room to flex before you flex the price.
Journey Foods connects supplier data, sourcing alternatives, and formulation checks in one place, so a shortage doesn't turn into a shelf problem. Book a demo to find your blind spots before your next order.
The Lesson
This looks more like 2008 than 1973
The last time food prices climbed this broadly at once, it wasn't one bad harvest. It was 2008. Grain, dairy, sugar, and oil moved together, pushed by weather, energy costs, and buying that fed on itself. Exporting countries restricted trade to protect their own supply, which pushed prices up faster everywhere else.
That's the closer parallel here, not the 1973 grain embargo, which was one country cutting off one buyer. This is broader and self-reinforcing, and tariffs layered on top of a spike like this tend to compound it rather than offset it. When costs move together across categories, a single-ingredient hedge does less work. Plan for the whole basket, not just the line that spiked last quarter.

What You Do Now
Four decisions to make this week
1. Check exposure past the ingredient. Packaging, equipment, and parts count too, not just what's in the recipe.
2. Confirm what's already in transit. Goods moving before today are exempt. Know your dates before you assume a hit.
3. Qualify a backup supplier now. It's cheaper to do this today than to scramble once a shipment is stuck.
4. Protect how your price looks, not just what it is. Pack size and promo timing carry more weight than a straight hike right now.
Journey Ingredient Intelligence
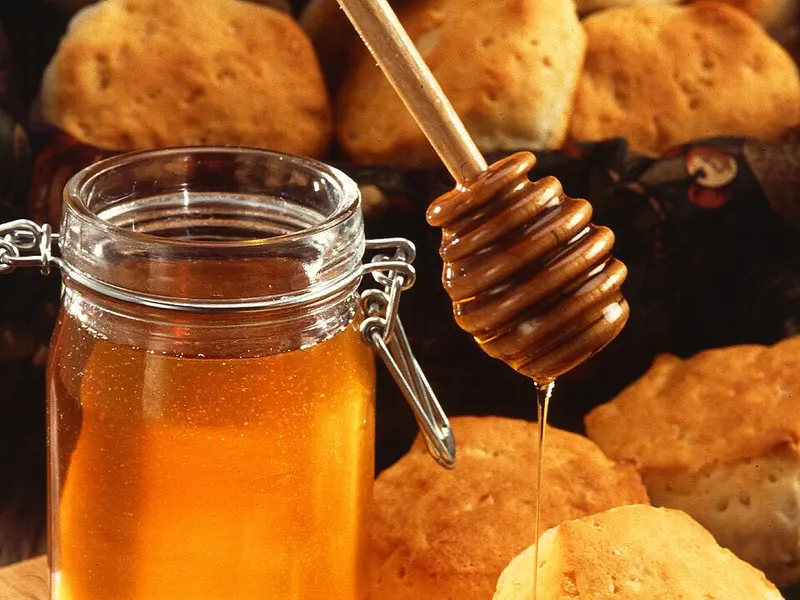
Honey
Milk and cream, whey and whey protein concentrate, casein, milk albumin, cheese, honey, molasses, malt extract, baking mixes, and dough products are all named directly.
Honey: 304 kcal and 0.3 g protein per 100 g; top producer China (22.4%, 2024); 1.57 kg CO2e per kg.
Explore Honey dataAs published
1.9%
Supplier highlight
1000 Springs Mill
Lists Brown Beans, Butterfly Popcorn, White Wheat Flour, Flint Corn, Blue on the market graph.
View 1000 Springs Mill dataJourney Ingredient Intelligence · Comparison
Wheat flour
Honey
Data from this story
Shareable Journey Intelligence
Geopolitical Snacks: This is the biggest food shock since 2008.
Industry Insights
1.9%
In August it climbed to 133.3, up 1.9% from July and 2.5% above last year.
12%
Sugar led the climb, up almost 12%, on weather, lower output in Brazil, and India allowing duty-free raw-sugar imports.