Geopolitical Snacks: Food vs AI, Hormuz, food prices + dates to watch


Quick answer
Plus, JAI's food price outlook, Hormuz drops to 7 ships a day + what's coming | 8 min read

Hey Geo Fam,
Quick question before the shipping lanes: what's the bigger threat to your health this century, artificial intelligence or what's on your plate? A big new Lancet report has an answer, and it's the lead story today. Grab a coffee. This one is worth the read.
Same format as last time. Every story comes in three parts: what happened, what it means, and why you should care. Plain words, no decoder ring.
The short version: food-driven obesity tops a list of 17 global health threats, ahead of malicious AI. Hormuz traffic fell to single digits again. World food prices rose in September. And the farmers growing next year's crops are paying a lot more for diesel and fertilizer. None of it hits your invoice tomorrow. All of it is heading there.
Stay sharp,
Antonio & Team 🌱
👀 What's moving
JAI projections plus the latest readings.
JAI food price index
+1.0%
next 3 mo (range 0.7 to 1.5%)
JAI 6-month outlook
+1.9%
to Feb 2027
JAI sugar & sweets
+1.2%
3 mo, strongest-tested category
Hormuz ships/day
7
▼ from ~125 pre-war
US diesel
+45%
since March
Russian wheat exports
2.7 Mt
▼ from 4.9 Mt
In this issue
● 🍽️ Big Picture: Food beats AI as a health threat
● 📈 JAI Outlook: Grocery prices up about 1% by November
● 📈 Chart of the Day: Food prices rose again
● 🚢 Chokepoint Watch: Three shipping lanes squeezed
● 🛃 Policy Move + Border Watch: Tariff cuts, closed doors
● 🚜 The Farm Side: The Hormuz tax on every acre
Journey Ingredient Intelligence
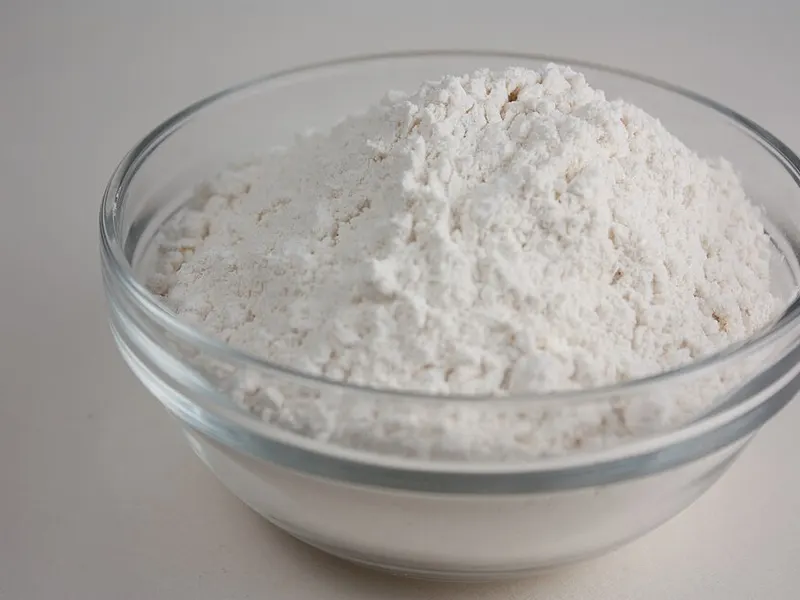
Wheat flour
JAI food price index +1.0% next 3 mo (range 0.7 to 1.5%) JAI 6-month outlook +1.9% to Feb 2027 JAI sugar & sweets +1.2% 3 mo, strongest-tested category Hormuz ship…
Wheat flour: 364 kcal and 10.3 g protein per 100 g; top producer China (17.5%, 2024); 1.57 kg CO2e per kg.
● 📅 What's Coming: Dates to watch before November
Big Picture
The Plate Beats The Bot
What's going on here?
On Oct 11, The Lancet Commission on 21st Century Global Threats to Health named 17 threats that could each cost at least a billion years of healthy life by 2100. It measures them in DALYs, which is just years of healthy life lost to illness, disability or early death, and it counts only the part policy could still prevent.
Two threats carry extinction risk: nuclear conflict and the malicious use of AI. Weighted for how likely they are, preventing malicious AI could save about 10.4 billion healthy years (Lancet via Scimex). Obesity, which the Commission defines as high body weight, poor diet and low physical activity, comes in at 23.1 billion, the biggest number on the list (IHME).
Chart: Journey Foods. Source: Lancet Commission on 21st Century Global Threats to Health, Oct 2026 (selected threats).
What does this mean?
Diet shows up more than once. Childhood malnutrition, high blood pressure and high alcohol use are also on the list of 17. The AI number is a low-probability, high-impact estimate, while the food numbers are burdens that build every year, so they aren't measuring the same kind of risk. The Lancet's own editors say it's not a fixed ranking. Still, the message is clear: the slow threat in the pantry is bigger than the fast one in the headlines.
Why should I care?
AR Antonio Romero, LATAM Growth & Indigenous Partnerships
The bigger picture: slow beats fast. The AI number is a one-time catastrophe estimate; the diet numbers pile up every single year.
For brands: governments that worry about these numbers write labels, taxes and school food rules. If your products lean on sugar, salt or refined fat, expect more pressure, not less. The brands that can show what's in each product, and swap ingredients without losing taste, will have an easier decade.
You might also like ⇢ Ultra-processed foods vs. traditional diets: a brand playbook
JAI Outlook
What shoppers pay next
JAI projects 📈 Our in-house model, JAI (Journey AI), reads FAO's global food prices, world wheat, corn, soy, sugar and cocoa, US diesel and the dollar, then projects what U.S. shoppers will pay.
JAI projects U.S. grocery prices rise about 1.0% from August to November (likely range 0.7% to 1.5%) and about 1.9% by February (1.3% to 2.5%). Sugar and sweets lead at +2.0% over six months; dairy is softest at +0.8%. Globally, FAO's index hit 136.0 in September, and JAI sees it near 137 by December before easing toward 135 by March.

Chart: Journey Foods JAI model. Inputs: BLS, FAO, World Bank, EIA, Federal Reserve.
⚠️ In backtests JAI cut the "no change" error in half for the headline index, but it doesn't yet beat "no change" for grains, dairy or oils, so we hold those calls loosely. Tariffs and weather can move faster than any model.
JAI is Journey's food price model. Sign in to see how it reads your ingredients.
Chart of the Day
Grain Gets Pricey
What's going on here?
The FAO Food Price Index averaged 136.0 in September, up 1.5% from August and 5.8% from a year ago. Think of it as the price tag on a global grocery basket.
What does this mean?
Crops did the lifting. Wheat rose 6.3%, maize 5.6% and sugar 6.1% in one month, while meat fell 1.1%.

Chart: Journey Foods. Source: FAO Food Price Index, Oct 2, 2026.
Why should I care?
AR Antonio Romero, LATAM Growth & Indigenous Partnerships
FAO's chief economist put it plainly: "If sustained, these pressures will soon pass through to consumer food prices." For brands: ask each supplier which index their quote follows, so you can tell market from markup before Q1 pricing locks.
Chokepoint Watch
Journey Ingredient Intelligence
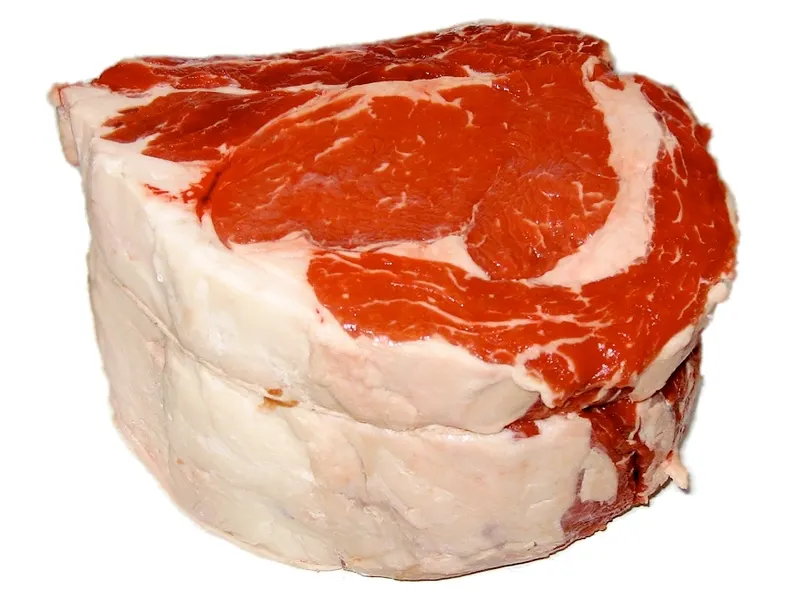
Beef
products that could get lower tariffs in China, including beef, dairy, corn and wheat.
Beef: 254 kcal and 17.2 g protein per 100 g; top producer United States (17.6%, 2024); 99.48 kg CO2e per kg.
Narrow Escapes
What's going on here?
Hormuz: about 125 ships crossed each day before the war began Feb 28. LSEG counted 8 on Oct 6 (Reuters via Al Arabiya), and trackers saw just 7 on Oct 12, the lowest since July (hormuz.now).
Black Sea: Russia shipped about 2.7 million tons of wheat in September, down from 4.9 million a year earlier (Tridge). Red Sea: some rerouted deliveries have taken 30 to 50 days longer (WFP).

Chart: Journey Foods. Sources: LSEG via Reuters/Al Arabiya; Rusagrotrans via Tridge.
What does this mean?
Hormuz moves oil and fertilizer, the Black Sea moves grain, the Red Sea links Asia and Europe. When all three slow at once, there are fewer backup routes.
Why should I care?
AR Antonio Romero, LATAM Growth & Indigenous Partnerships
For brands: add buffer weeks to lead times now, not after a purchase order is late.
Policy Move
A Menu, Not A Meal
What's going on here?
The first U.S.-China "30-for-30" lists name 1,619 U.S. products that could get lower tariffs in China, including beef, dairy, corn and wheat. Whole soybeans are left off (American Farm Bureau).
What does this mean?
Rates and start dates aren't out yet, so it's a menu, not a meal. At home, an executive order now lets 300,000 metric tons of beef in tariff-free.
Why should I care?
AR Antonio Romero, LATAM Growth & Indigenous Partnerships
For brands: don't budget China exports until rates publish. Beef buyers have more options now.
Border Watch
Who closed a door this week
● Libya: banned exports of farm products except dates (Libya Economy Journal).
● Philippines: fresh ube can't leave the country, likely until 2028. Processed ube can (Philippine Agriculture Dept.).
● EU: deforestation proof for cocoa, coffee and more is due Dec 30, 2026 (EUDR).
The Farm Side
Running On Diesel
What's going on here?
Since Hormuz closed, U.S. diesel is up 45%, and farms are set to spend a record $40 billion on fertilizer in 2026 (American Farm Bureau).

Chart: Journey Foods. Source: American Farm Bureau, Oct 8, 2026.
What does this mean?
That's nearly $30 more an acre for corn and over $70 for rice.
⚠️ No major row crop is projected to break even for 2026/27, per Farm Bureau.
Journey Ingredient Intelligence
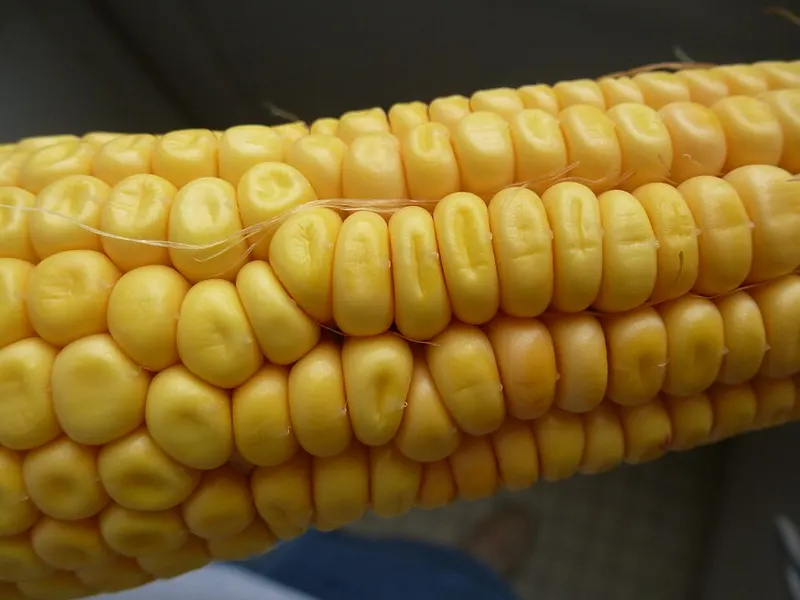
Corn
traditional diets: a brand playbook JAI Outlook What shoppers pay next JAI projects 📈 Our in-house model, JAI (Journey AI), reads FAO's global food prices, world whea…
Corn: 86 kcal and 3.3 g protein per 100 g; top producer United States (31%, 2024); 1.7 kg CO2e per kg.
Why should I care?
AR Antonio Romero, LATAM Growth & Indigenous Partnerships
For brands: this is a 2027 supply story. Talk volumes with growers before they decide what to plant.
You might also like ⇢ The Strait of Hormuz just moved your Q3 gross margin
What's Coming
Dates to watch
● Today, Wed Oct 14: September CPI at 8:30am ET. Watch "food at home" (BLS).
● Fri Oct 16: World Food Day, theme "Innovate today. Nourish tomorrow." (FAO).
● Sun Nov 1: OPEC+ sets December output (OPEC).
● Nov 6 and Nov 10: FAO's October index and USDA's WASDE crop forecast.
Journey Foods connects supplier data, sourcing alternatives, and recipe checks in one place, so a blocked lane doesn't turn into an empty shelf. Sign in to find your blind spots before your next order.
The Lesson
Shocks outlast headlines
Shipping networks have taken four to five months to settle after past disruptions (WFP). A ceasefire headline isn't your all clear. Plan for the lag, not the news.
From the Journey Blog
Fresh from our team
● UAE salt, sugar and fat limits
● Data centers with a conscience
What You Do Now
Three moves this week
1. Map ingredients to lanes. Know what moves through Hormuz, the Red Sea or the Black Sea.
2. Add buffer to lead times. Build 30 to 50 days of slack into Q1 orders.
3. Line up a swap. A second origin and a tested recipe change keep you shipping.
🎯 On our radar
1. Calm in a can. Hemp THC drinks face a 0.4 mg per container cap on Dec 11, and the Nowadays founders just launched zero-THC Unwind in about 1,000 Walmart stores.
2. Más sabor. 7-Eleven rolled out Selección 7, a Hispanic-inspired private label line of conchas, mantecadas and chamoy candy.
3. Diwali goes global. Overseas buyers expect about 6% growth in Indian festive food orders, led by the Gulf, per a TPCI survey.
Stay sharp 😉
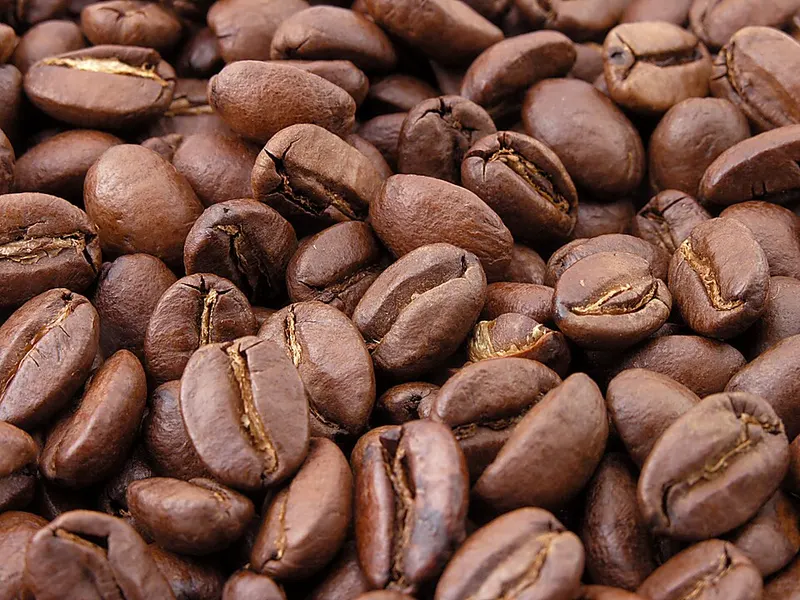
Journey Ingredient Intelligence
Coffee
Grab a coffee.
Coffee: 1 kcal and 0.1 g protein per 100 g; top producer Brazil (30%, 2024); 28.53 kg CO2e per kg.
As published
1.0%
Supplier highlight
1000 Springs Mill
Lists Brown Beans, Butterfly Popcorn, White Wheat Flour, Flint Corn, Blue on the market graph.
View 1000 Springs Mill dataJourney Ingredient Intelligence · Comparison
Wheat flour
Beef
Data from this story
Shareable Journey Intelligence
Geopolitical Snacks: Food vs AI, Hormuz, food prices + dates to watch
Industry Insights
1.0%
grocery prices rise about 1.0% from August to November (likely range 0.7% to 1.5%) and about 1.9% by February (1.3% to 2.5%).
2.0%
Sugar and sweets lead at +2.0% over six months; dairy is softest at +0.8% .