.svg)
.svg)
.svg)
.svg)


.svg)
Sustainability teams at CPG companies have spent the last decade getting good at carbon. Scope 3 emissions, cradle-to-gate CO2e, lifecycle assessments — the vocabulary is established, the tools exist, the reporting frameworks are mature.
Quick Answer: Biodiversity scoring assigns measurable impact values to ingredients based on how their sourcing affects ecosystem health, species richness, and land use. For CPG sustainability teams, it turns a vague commitment into a procurement filter you can actually act on.
Key Takeaways:
Biodiversity is where carbon was in 2015. The pressure is building, the frameworks are arriving, and most teams are still figuring out what to measure.
This guide is written for R&D leads, procurement managers, and sustainability directors who need to operationalize biodiversity scoring before it becomes a compliance requirement rather than a competitive signal.
Biodiversity scoring quantifies how an ingredient's sourcing affects living ecosystems. That covers several distinct dimensions:
No single number captures all of this cleanly. Most scoring frameworks produce a composite index, often weighted by the relative sensitivity of the sourcing region. The Biodiversity Footprint for Food and Agriculture (BFFA) methodology and the GLOBIO model are among the more widely cited approaches, though industry standardization is still in progress.
What matters for your team: biodiversity scoring is not one number per ingredient category. It's a score per ingredient-origin combination. Palm oil from a certified sustainable Malaysian supplier scores differently from palm oil sourced from a newly cleared Indonesian concession. That distinction has to live in your ingredient data.
Three forces are converging.
Regulatory pressure. The EU's Corporate Sustainability Reporting Directive (CSRD) and the Taskforce on Nature-related Financial Disclosures (TNFD) framework both require companies to assess and disclose nature-related risks. Biodiversity impact is explicitly included. If you sell into European retail or have EU-based investors, this is no longer optional.
Retailer requirements. Major grocery retailers are building nature-positive procurement policies. Some are already asking suppliers for biodiversity impact data as part of vendor qualification. That requirement is moving downstream to ingredient suppliers fast.
Consumer signal. Regenerative agriculture, "nature positive," and ecosystem health are showing up in consumer-facing claims. Brands that can substantiate those claims with actual scoring data have a defensible position. Brands that can't are exposed.
For a broader view of what sustainability metrics CPG brands are actually tracking right now, the Food Sustainability Metrics: What CPG Brands Are Actually Measuring in 2026 breakdown is worth reading alongside this guide.
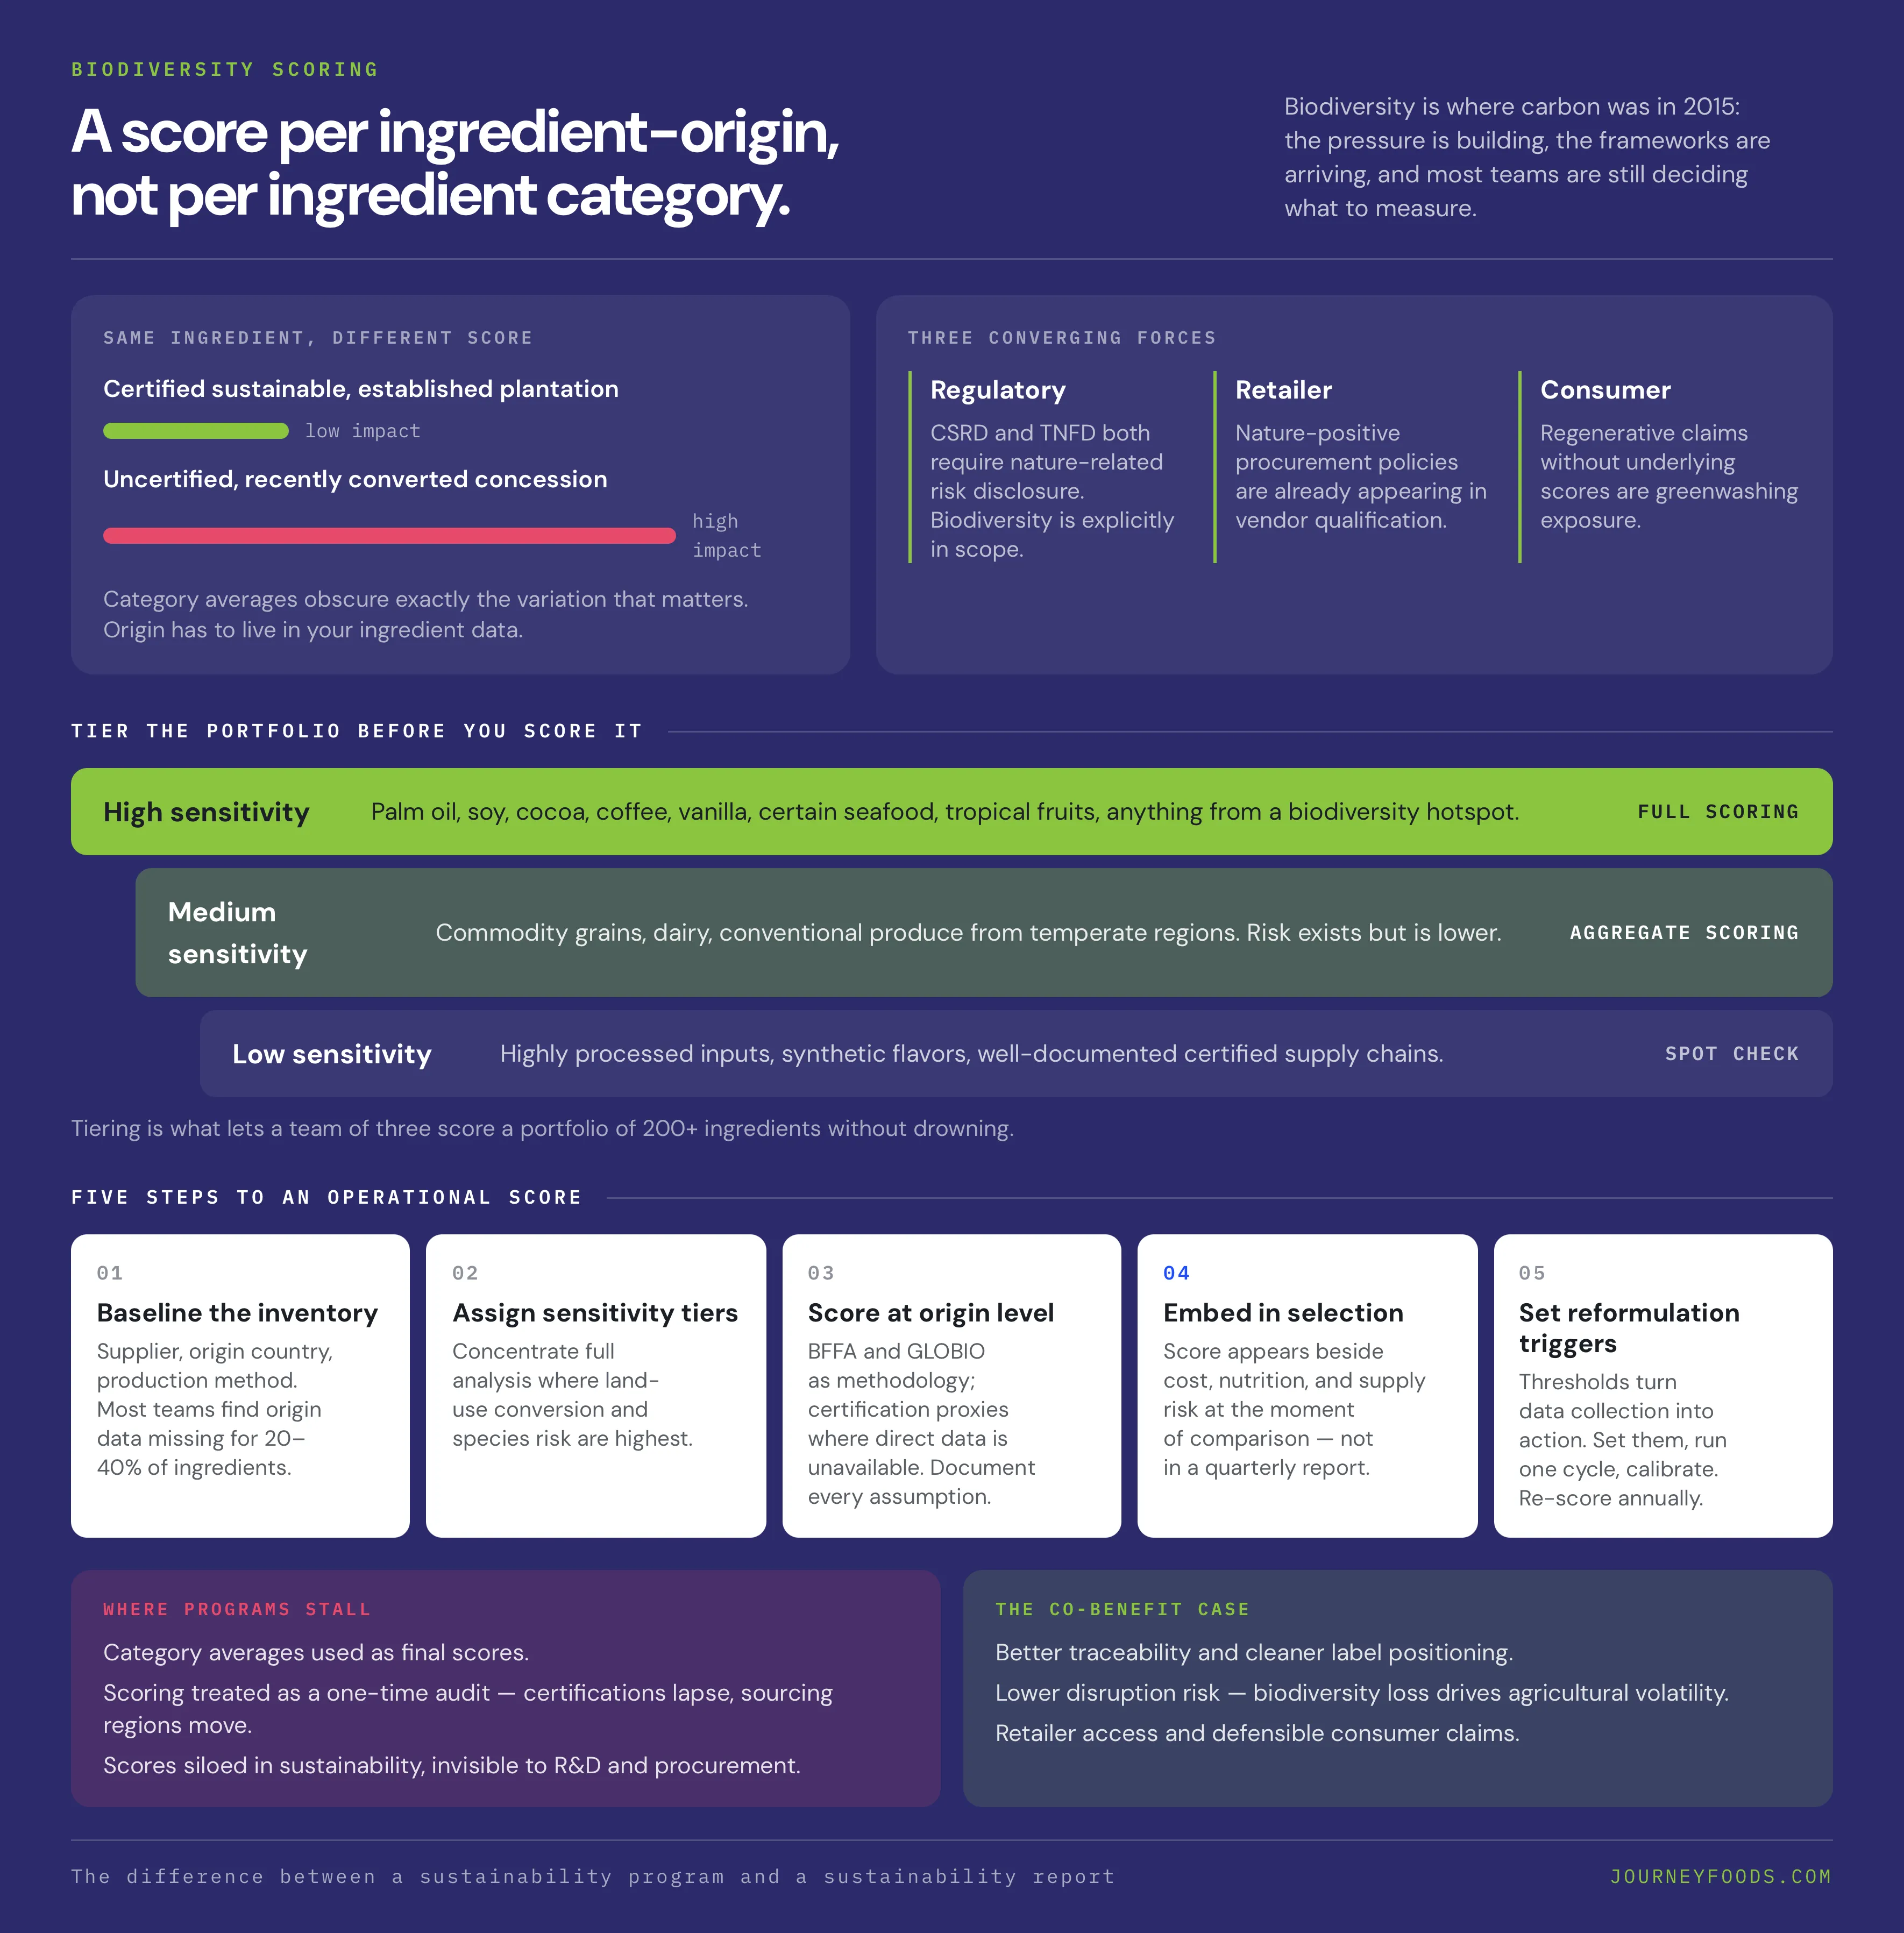
You cannot score what you haven't mapped. Start with a complete list of your active ingredients — supplier, origin country, and production method where available. Most teams discover gaps here. Origin data is missing for 20–40% of ingredients, and production method data is worse.
This is the foundational problem biodiversity scoring exposes. If your ingredient data lives in disconnected spreadsheets and supplier email chains, scoring at scale is impossible. The data infrastructure has to come first.
Not every ingredient needs the same depth of analysis. A tiering approach focuses effort where biodiversity risk is highest.
High-sensitivity ingredients (require full scoring): Palm oil, soy, cocoa, coffee, vanilla, certain seafood, tropical fruits, and any ingredient sourced from a recognized biodiversity hotspot. These categories carry the highest land-use conversion and species impact risk.
Medium-sensitivity ingredients: Commodity grains, dairy, conventional produce from temperate regions. Risk exists but is lower; aggregate scoring is usually sufficient.
Low-sensitivity ingredients: Highly processed inputs, synthetic flavors, and ingredients with well-documented certified supply chains. Spot-check rather than full audit.
This tiering lets a team of three handle biodiversity scoring across a portfolio of 200+ ingredients without drowning.
Generic category scores are a starting point, not an answer. The goal is origin-specific data. That means:
Where direct data is unavailable, document the assumption. Auditable methodology matters as much as the score itself when you're preparing for TNFD disclosure.
This is where most sustainability programs stall. The biodiversity data gets compiled into a report, filed in a shared drive, and never touches an actual formulation decision.
The fix is embedding scores into the ingredient search and evaluation workflow. When an R&D scientist is comparing three emulsifier options, biodiversity score should appear alongside cost, nutrition profile, and supply chain risk — not in a separate sustainability report reviewed quarterly.
That's exactly the integration Journey Foods is built for. The Operations Scientist AI engine lets teams score ingredients across nutrition, cost, and sustainability criteria simultaneously, so biodiversity data becomes part of the selection decision rather than an afterthought. When your entire team works from the same ingredient data, scoring doesn't get lost between R&D and procurement.
For teams evaluating what tools can support this kind of integrated scoring, the Best AI-Powered Ingredient Management Platforms for CPG Companies in 2026 comparison covers the landscape.
Scoring without thresholds is just data collection. Define what score triggers action:
These thresholds don't need to be perfect on day one. Set them, run one product cycle, and calibrate based on what you find. The discipline of having thresholds at all separates teams that are operationalizing sustainability from teams that are performing it.
Using category averages as final scores. Palm oil is not a single biodiversity impact. Certified sustainable palm from an established plantation is categorically different from uncertified palm from a recently converted concession. Category averages obscure exactly the variation that matters.
Treating biodiversity scoring as a one-time audit. Supplier sourcing regions change. Certifications lapse. A score that was accurate eighteen months ago may not reflect current reality. Build in annual re-scoring for high-sensitivity ingredients.
Keeping scoring siloed in sustainability. If R&D doesn't see biodiversity scores when selecting ingredients, the data has no leverage. Procurement needs it when negotiating supplier contracts. Marketing needs it when building claims. The score has to flow across functions.
Ignoring co-benefits. Ingredients with strong biodiversity scores often correlate with better traceability, lower supply chain disruption risk, and cleaner label positioning. Biodiversity-positive sourcing is frequently a cost and risk story, not just an environmental one. For teams working through the cost side of this, Food Ingredient Cost Optimization: How CPG Teams Cut 28% Without Sacrificing Quality is a useful parallel read.
Most suppliers aren't presenting biodiversity data proactively. You'll need to ask for it. The questions that get useful answers:
Suppliers who can answer these questions clearly are already ahead of the curve. Those who can't are a risk — not just environmentally, but in terms of future regulatory exposure.
For a broader view of how to evaluate and qualify sustainability-forward suppliers, Better Sustainability: Key Suppliers and Services covers supplier qualification frameworks in more depth.
Sustainability teams often need to sell biodiversity scoring internally before they can implement it. The arguments that land with finance and operations:
Regulatory risk mitigation. TNFD disclosure requirements and EU supply chain due diligence regulations create direct liability for companies that can't demonstrate nature-related risk management. Biodiversity scoring is the documentation layer.
Retailer access. Several major retailers are building nature-positive sourcing requirements into supplier contracts. Companies without a scoring methodology will lose shelf space. That's a revenue argument, not just a sustainability one.
Brand defensibility. Consumer-facing claims around regenerative agriculture and ecosystem health are growing. Without underlying data, those claims are greenwashing exposure. With scoring, they're substantiated.
Supply chain resilience. Biodiversity loss increases agricultural volatility. Ingredients sourced from monoculture-dependent or ecologically stressed regions carry higher supply disruption risk. Scoring identifies that risk before it becomes a procurement crisis.
What is biodiversity scoring in the context of ingredient selection?
Biodiversity scoring assigns a measurable impact value to an ingredient based on how its sourcing affects ecosystems, species richness, land use, and habitat. Scores are calculated at the ingredient-origin level rather than by ingredient category alone — because the same crop can carry very different impacts depending on where and how it was grown.
Which ingredients carry the highest biodiversity risk for CPG companies?
Palm oil, soy, cocoa, coffee, vanilla, certain seafood, and tropical fruits consistently rank as high-sensitivity ingredients. These categories are associated with significant land-use conversion, sourcing in biodiversity hotspots, and monoculture risk. They should be prioritized for full scoring rather than category-level estimates.
What frameworks or methodologies should CPG teams use for biodiversity scoring?
The Biodiversity Footprint for Food and Agriculture (BFFA) methodology and the GLOBIO model are among the most cited scientific approaches. The TNFD framework provides the disclosure structure for nature-related risks. Certification proxies like Rainforest Alliance and RSPO can serve as interim scoring inputs where direct data is unavailable.
How does biodiversity scoring differ from carbon footprint measurement?
Carbon footprinting measures greenhouse gas emissions, expressed as CO2 equivalent per unit. Biodiversity scoring measures impact on living ecosystems — land use, species impact, water stress, habitat conversion. The two metrics are related but distinct. A low-carbon ingredient can still carry high biodiversity risk.
How often should CPG teams update their biodiversity scores?
High-sensitivity ingredients should be re-scored annually at minimum, and any time a supplier changes sourcing region or certification status. Biodiversity risk is dynamic — it reflects current land use and ecosystem conditions, not a fixed characteristic of an ingredient category.
How do you integrate biodiversity scores into formulation decisions without slowing down R&D?
Embed scores into the ingredient search and evaluation workflow rather than maintaining them in a separate sustainability report. When biodiversity data appears alongside cost, nutrition, and supply chain risk at the point of ingredient selection, it informs decisions without creating an additional review step.
Is biodiversity scoring required for CSRD or TNFD reporting?
TNFD explicitly requires companies to assess and disclose nature-related risks, which includes biodiversity impact. CSRD requires disclosure of impacts on biodiversity and ecosystems under its environmental reporting standards. Specific scoring methodologies aren't mandated, but companies need documented, auditable methodology to support their disclosures.
Biodiversity scoring is not a future capability. The regulatory frameworks are here, the retailer requirements are arriving, and the brands building this into their ingredient selection process now will have a defensible position when disclosure becomes mandatory.
The teams that will struggle are the ones waiting for a perfect methodology before starting. Start with your high-sensitivity ingredients, establish origin data, set thresholds, and embed the scores where decisions actually get made.
That's the operational difference between a sustainability program and a sustainability report.
Explore how Journey Foods helps CPG teams score and manage ingredients across nutrition, cost, and sustainability criteria at Journeyfoods.io.